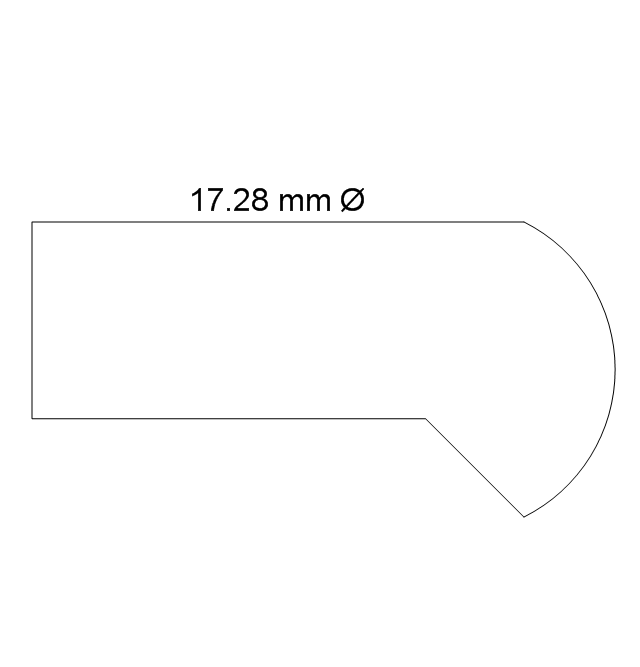
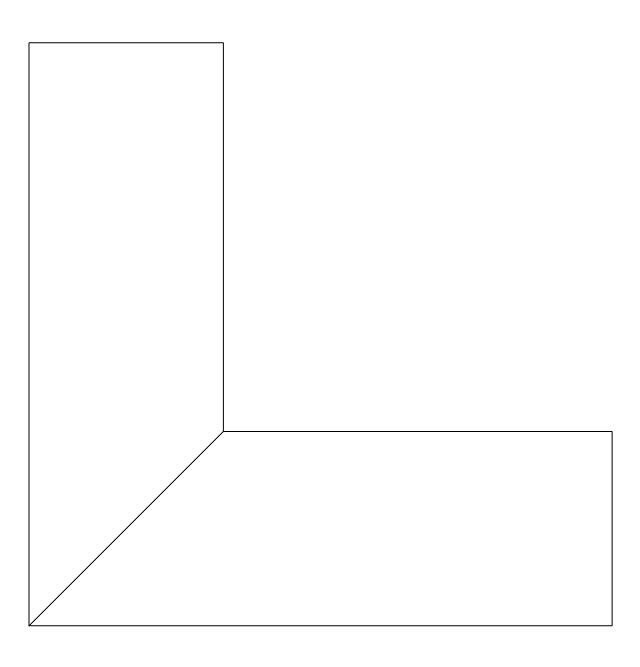
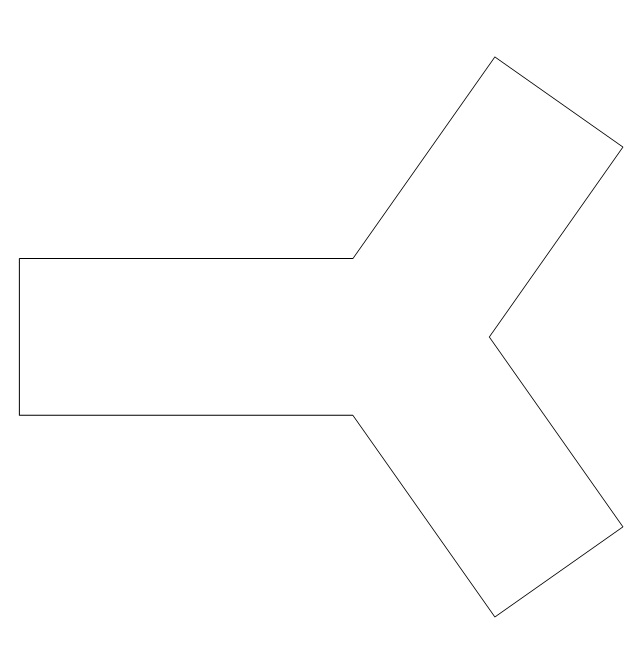
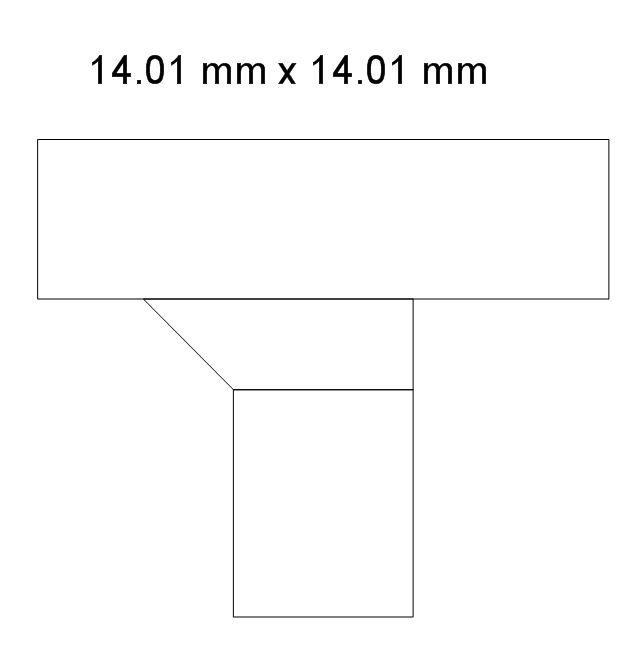
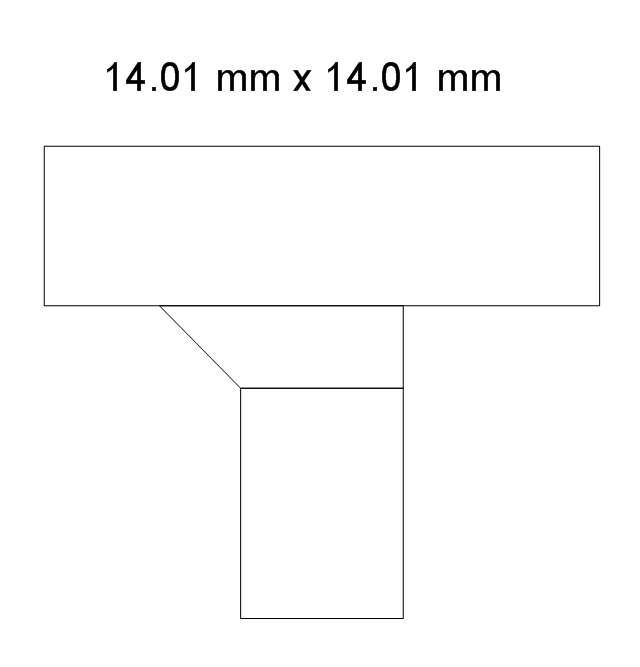
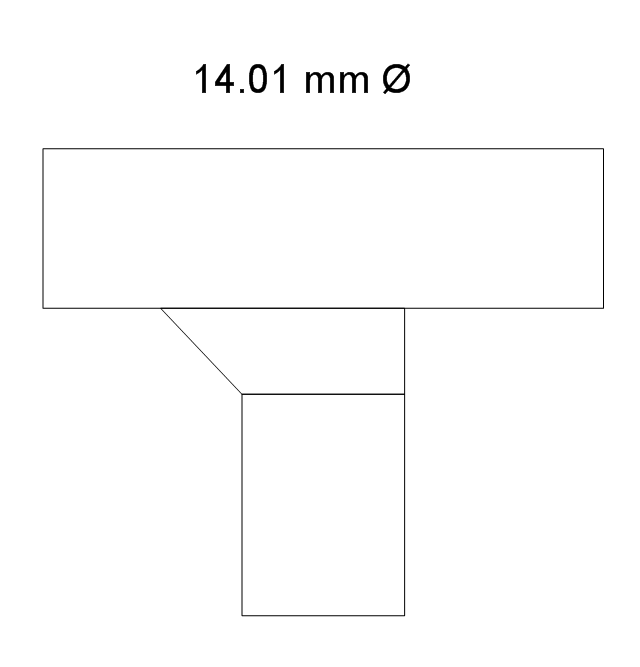
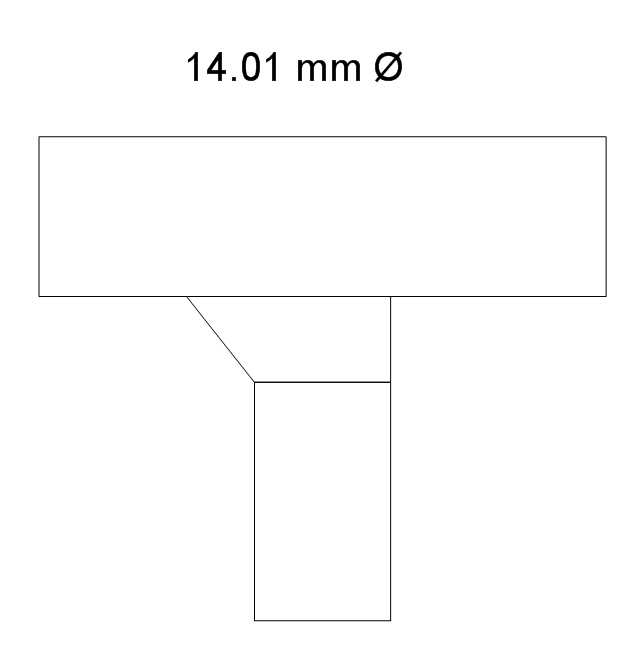
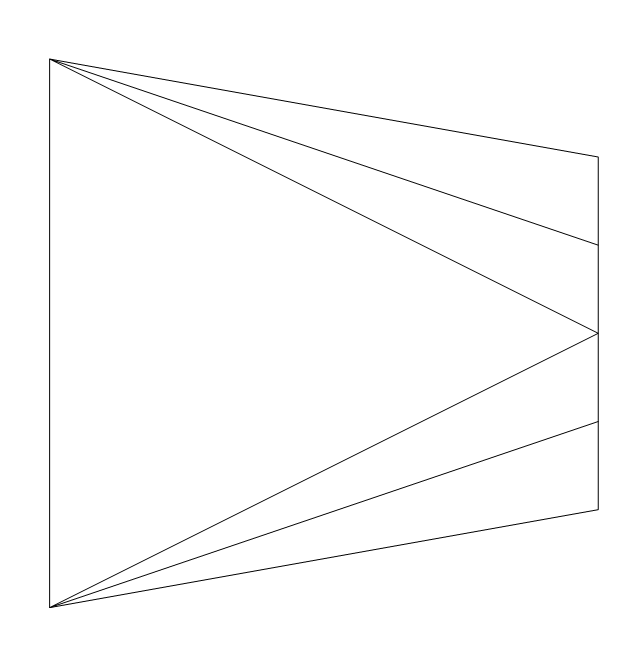
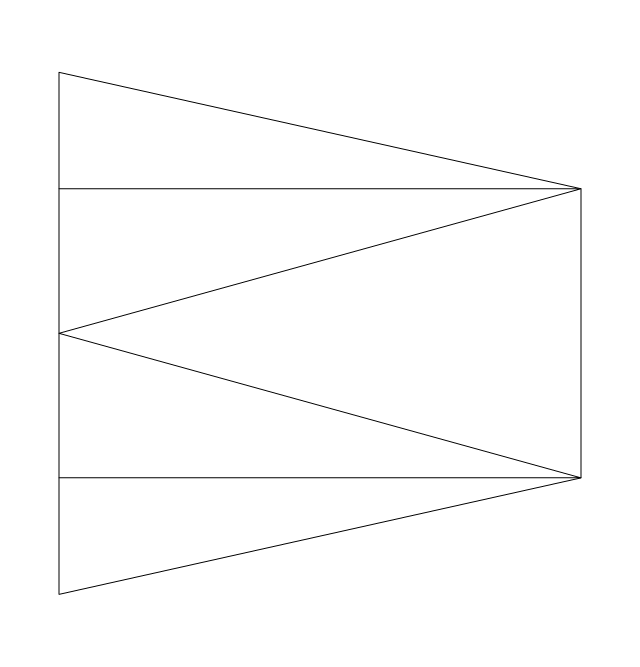
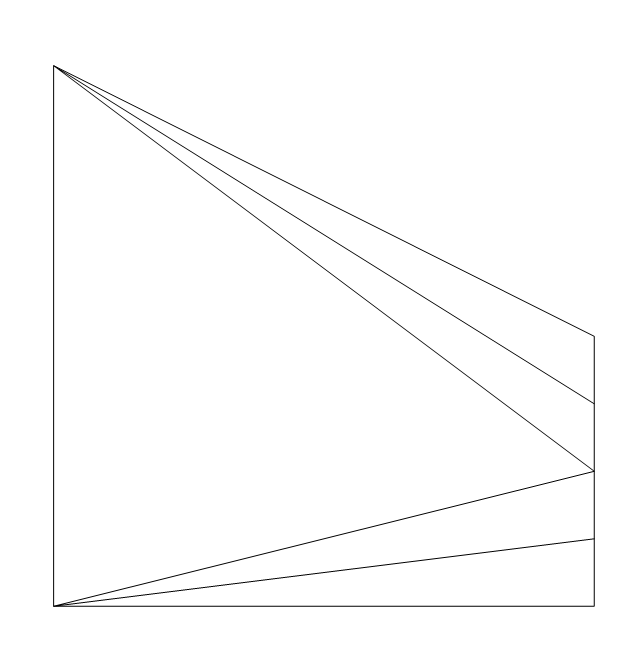
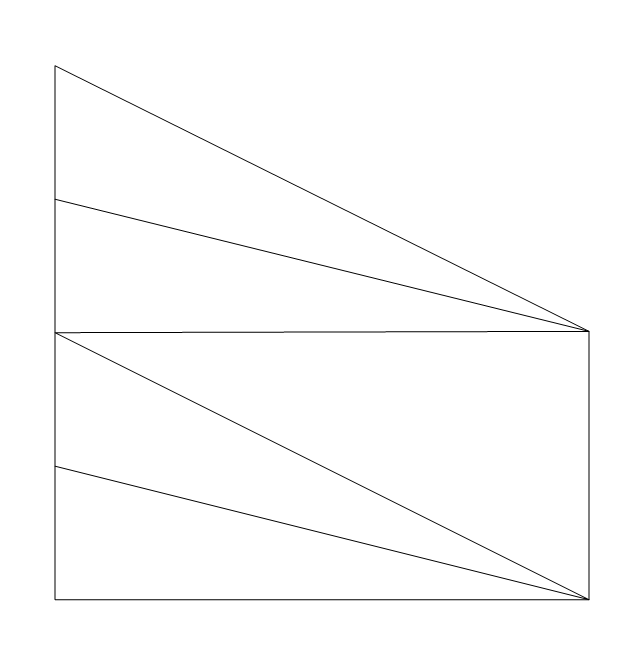
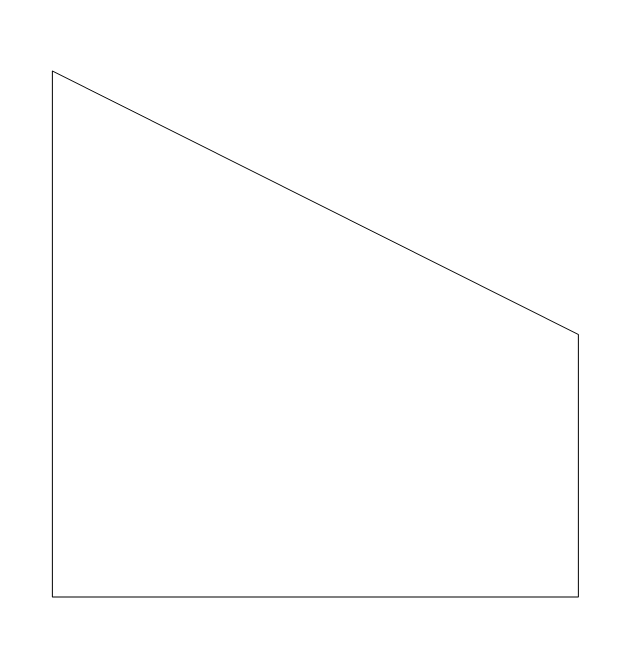
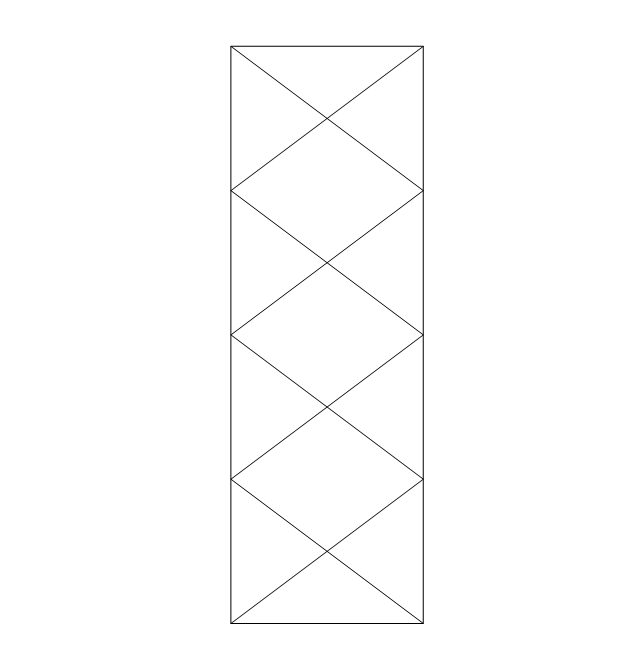
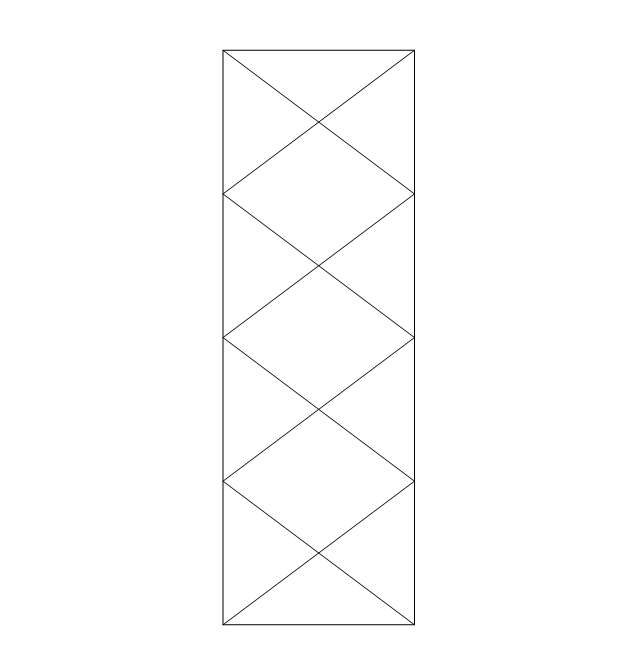
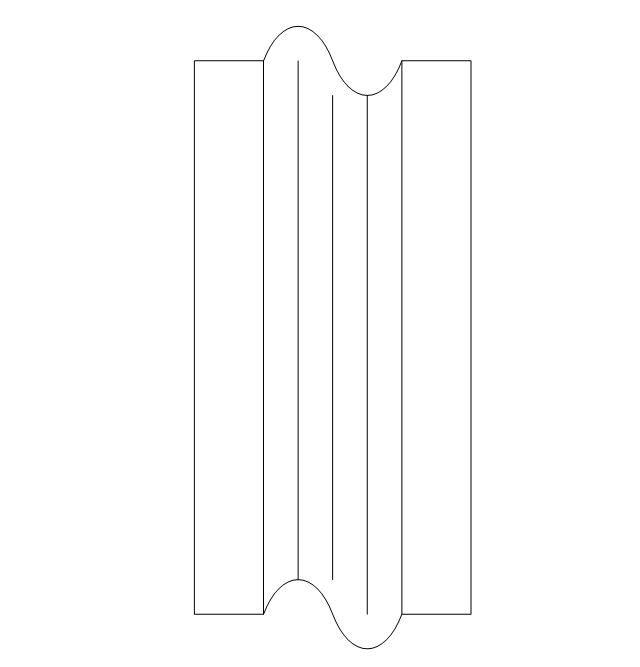
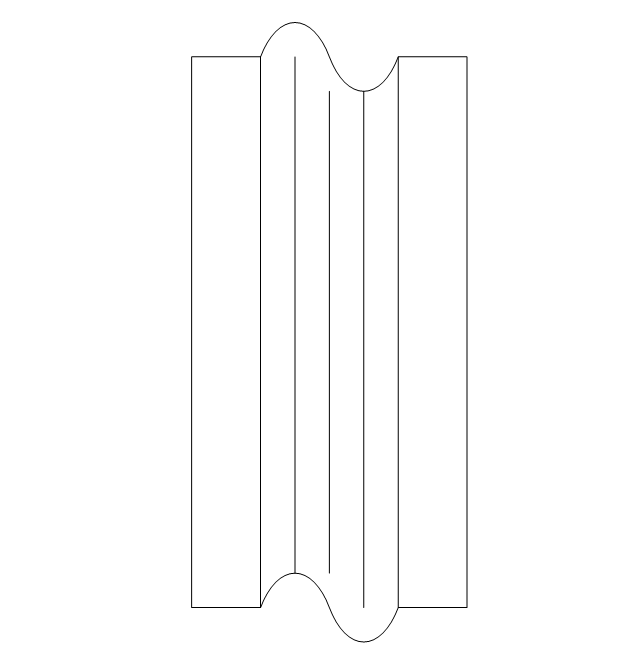
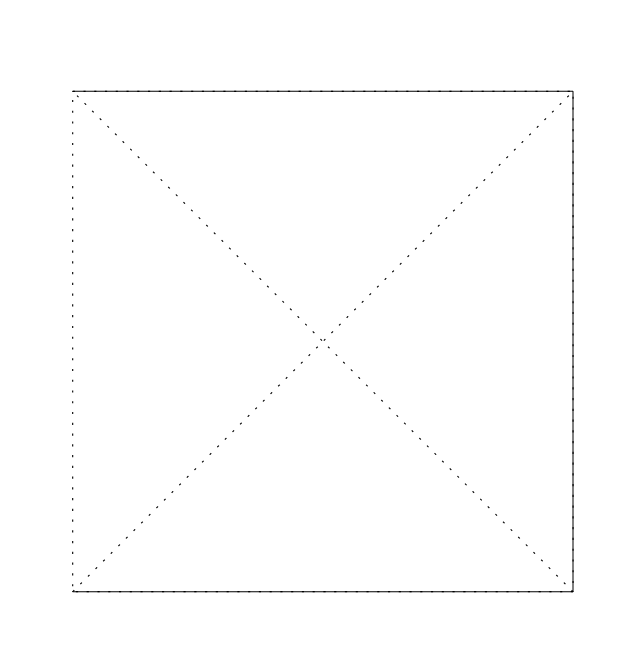
The vector stencils library "HVAC ductwork" contains 55 duct and vent symbols of HVAC mechanical components. Use it for drawing HVAC ductwork system diagrams, heating, ventilation, air conditioning, refrigeration, automated building control, and environmental control design in the ConceptDraw PRO diagramming and vector drawing software extended with the HVAC Plans solution from the Building Plans area of ConceptDraw Solution Park.
The vector stencils library "HVAC ductwork" contains 55 duct and vent symbols of HVAC mechanical components. Use it for drawing HVAC ductwork system diagrams, heating, ventilation, air conditioning, refrigeration, automated building control, and environmental control design in the ConceptDraw PRO diagramming and vector drawing software extended with the HVAC Plans solution from the Building Plans area of ConceptDraw Solution Park.
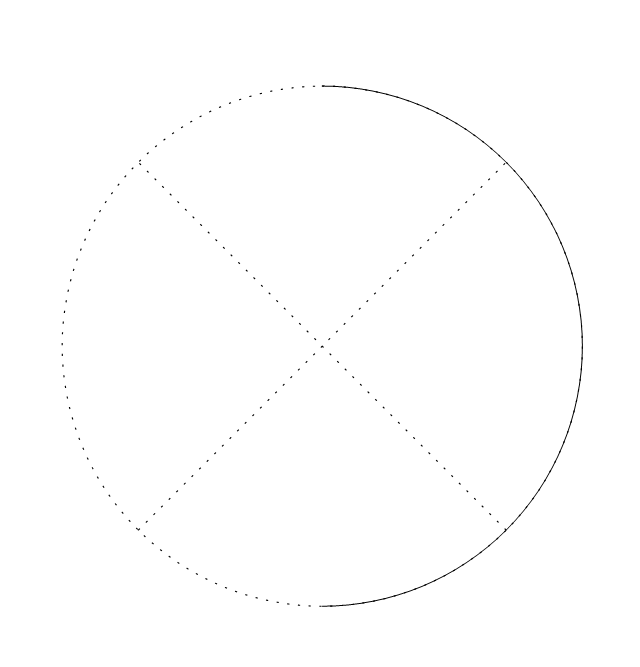
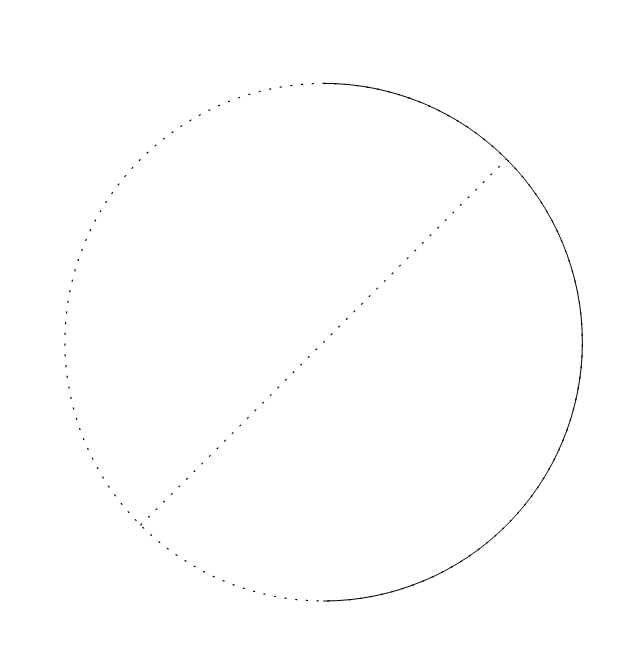
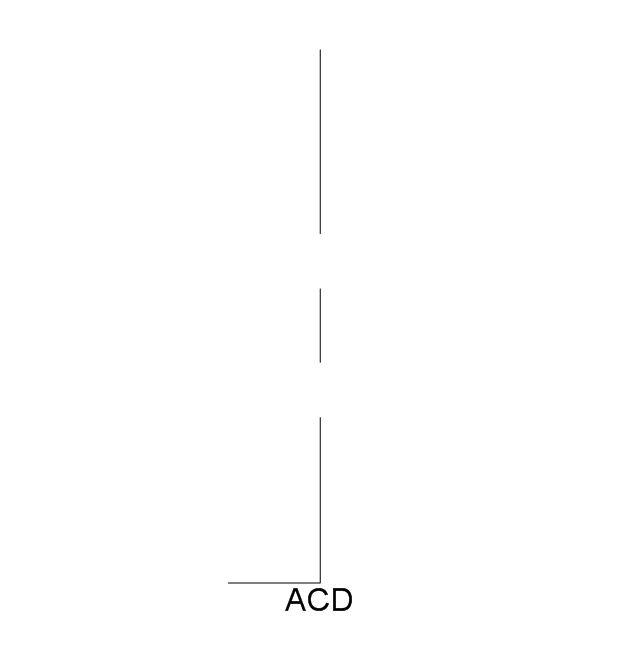
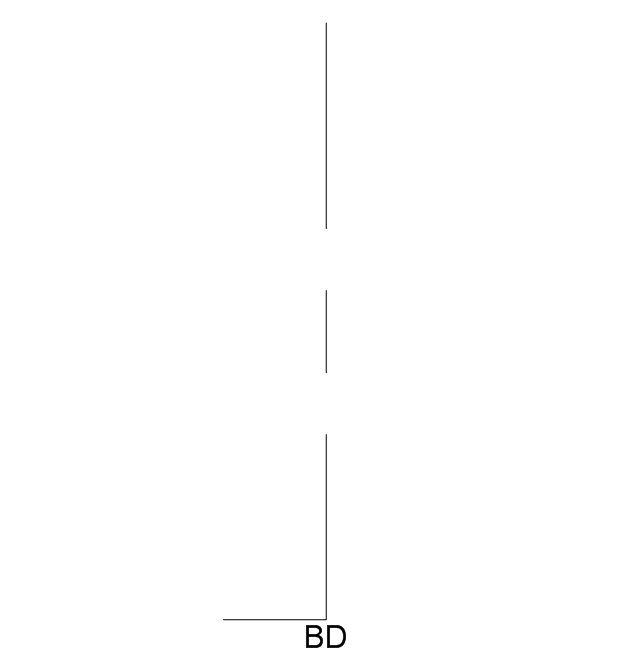
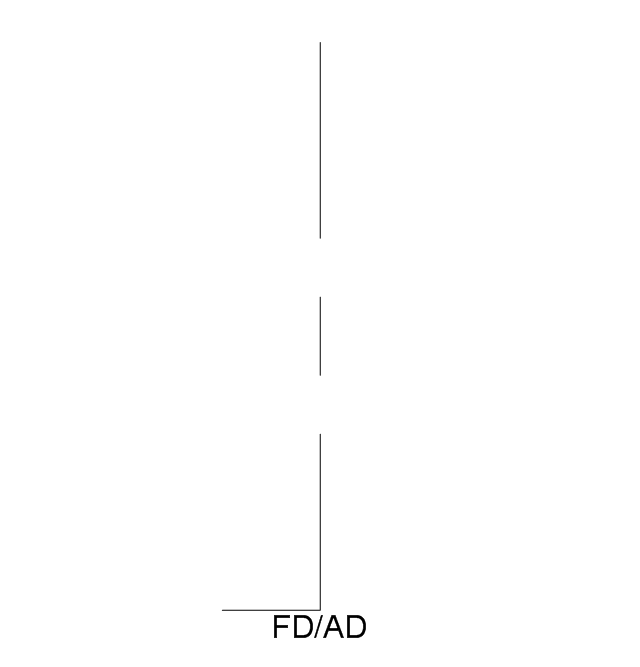
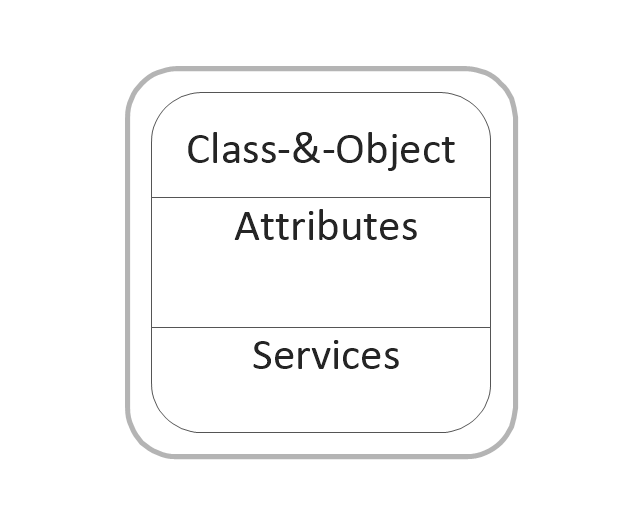
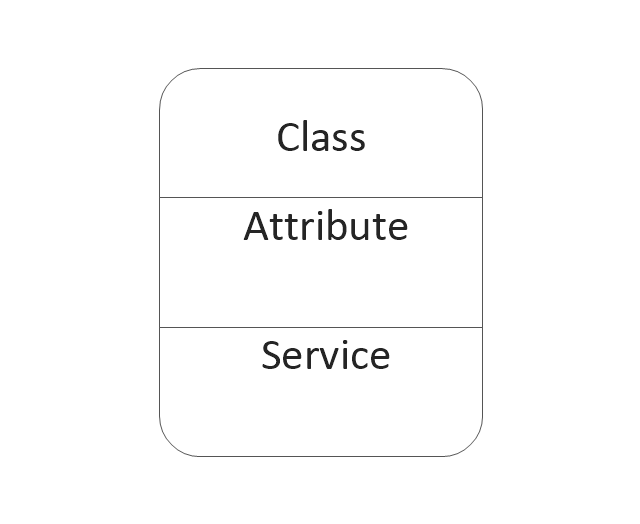
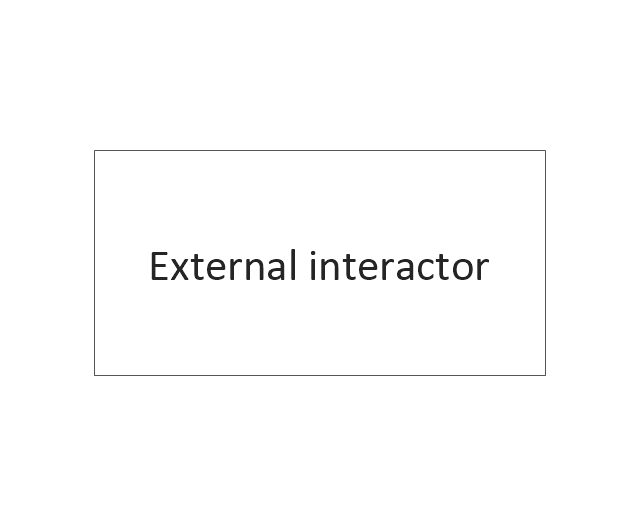
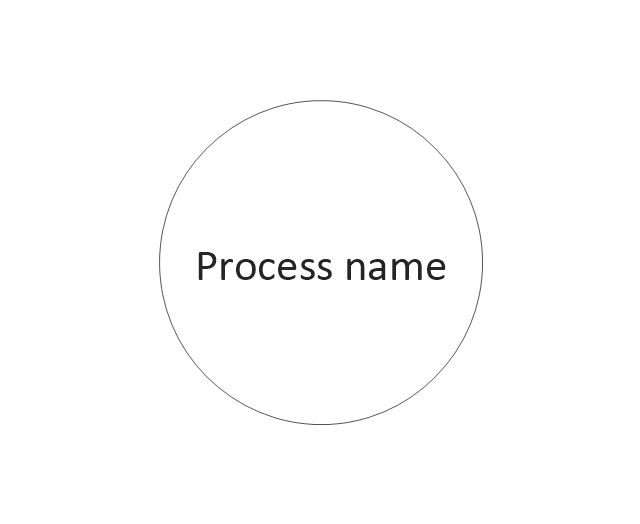
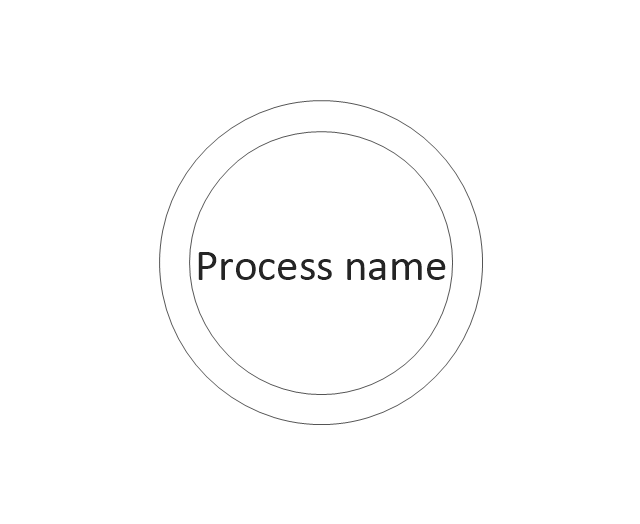
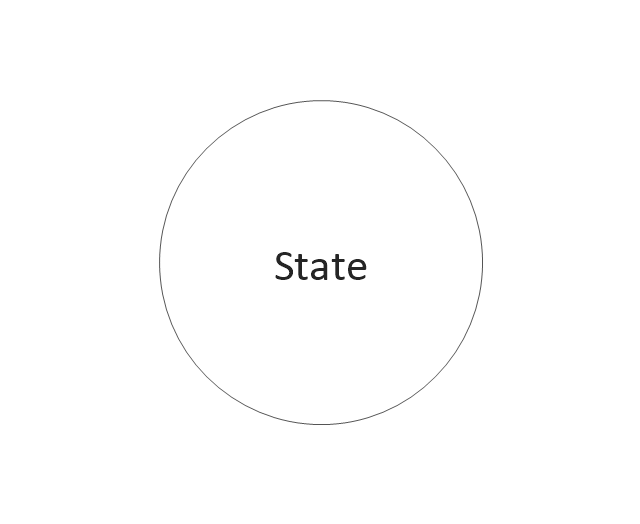
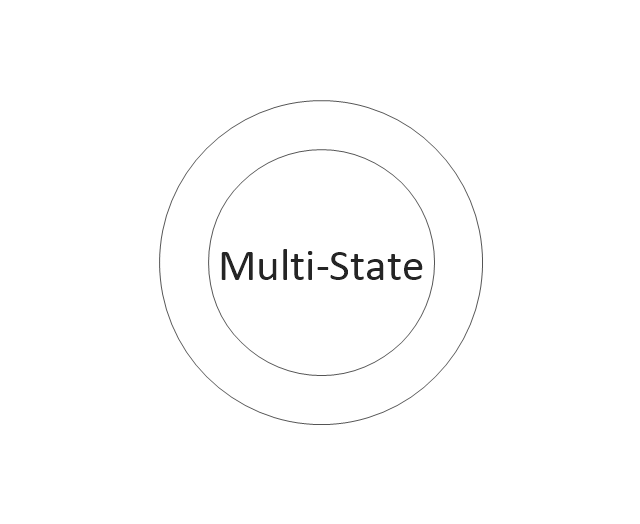
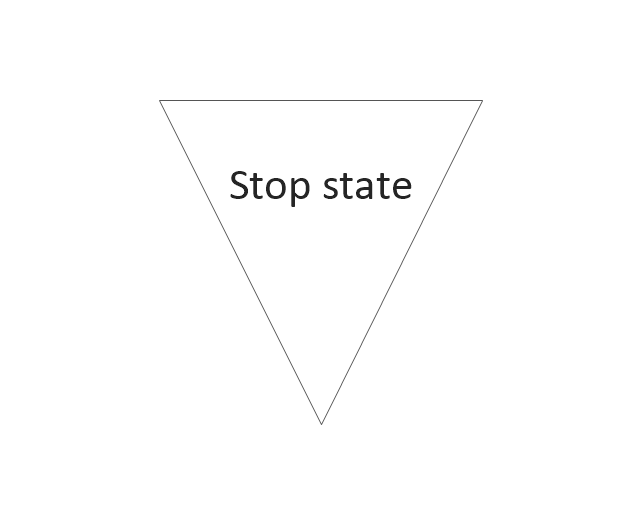
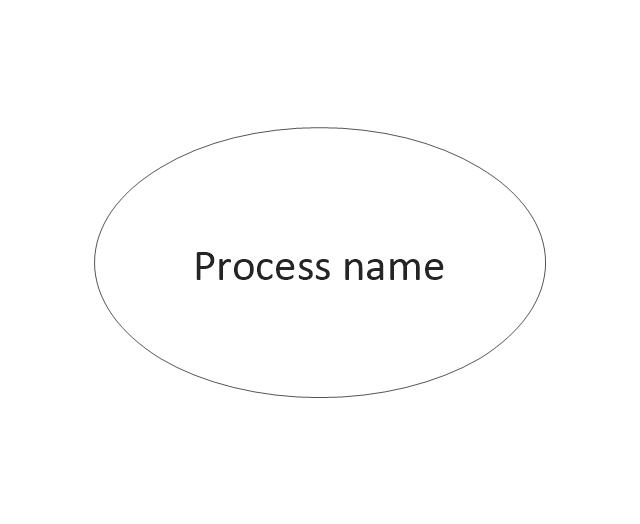
The vector stencils library "DFD, Yourdon and Coad notation" contains 22 DFD elements.
Use it for drawing data flow diagrams (DFD) using Yourdon/ DeMarco notation in the ConceptDraw PRO diagramming and vector drawing software extended with the Data Flow Diagrams solution from the Software Development area of ConceptDraw Solution Park.
Use it for drawing data flow diagrams (DFD) using Yourdon/ DeMarco notation in the ConceptDraw PRO diagramming and vector drawing software extended with the Data Flow Diagrams solution from the Software Development area of ConceptDraw Solution Park.
Purchasing Flow Chart. Purchasing Flowchart Example
This sample shows the Purchasing Flow Chart Diagram that displays the money flow in the carbon offset sphere. The carbon offsets are the compensatory measures that the companies make for the carbon emissions. You can see on this sample the groups that have interests in the carbon offsets and the money flow after the carbon offset vendors sold the carbon offsets.HelpDesk
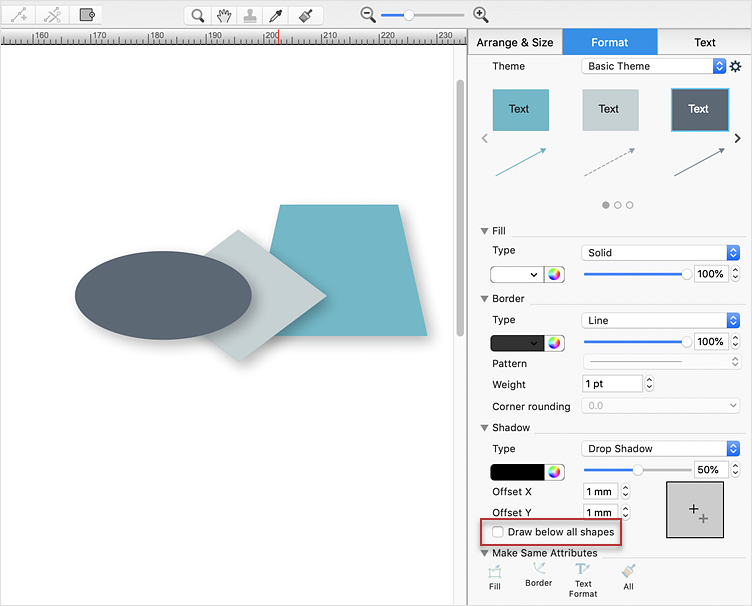
How to Edit Drawing Using Shadow
Tips on how to apply shadow to objects in the ConcepDraw drawingThe vector stencils library "DFD, Yourdon and Coad notation" contains 22 DFD elements.
Use it for drawing data flow diagrams (DFD) using Yourdon/ DeMarco notation in the ConceptDraw PRO diagramming and vector drawing software extended with the Data Flow Diagrams solution from the Software Development area of ConceptDraw Solution Park.
Use it for drawing data flow diagrams (DFD) using Yourdon/ DeMarco notation in the ConceptDraw PRO diagramming and vector drawing software extended with the Data Flow Diagrams solution from the Software Development area of ConceptDraw Solution Park.
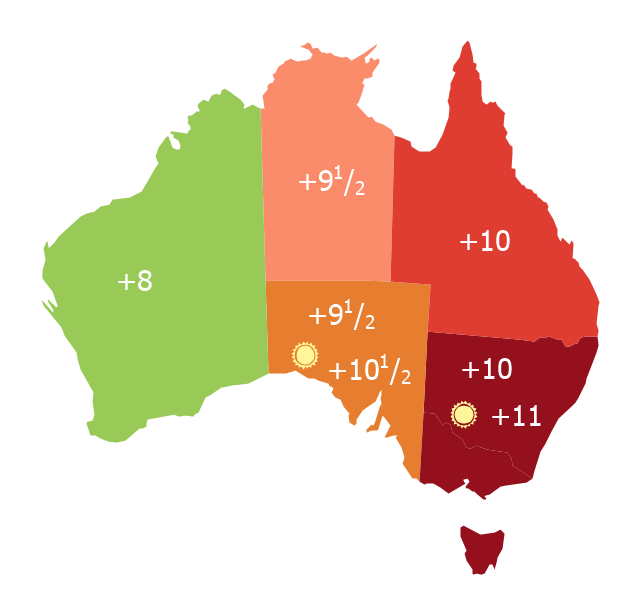
Map of Australia depicting time zones offsets from UTC by state (including daylight saving).
"Time in Australia uses more than three time zones, including Australian Western Standard Time (AWST; UTC+08:00), Australian Central Standard Time (ACST; UTC+09:30), and Australian Eastern Standard Time (AEST; UTC+10:00). Time is regulated by the individual state governments, some of which observe daylight saving time (DST). Australia's external territories observe different time zones." [Time in Australia. Wikipedia]
This thematic map was redesigned from Wikipedia file: Australia states timezones.png. [commons.wikimedia.org/ wiki/ File:Australia-states-timezones.png]
This file is licensed under the Creative Commons Attribution-Share Alike 3.0 Unported license.
[creativecommons.org/ licenses/ by-sa/ 3.0/ deed.en]
The thematic map example "Australia states time zones" was created using the ConceptDraw PRO diagramming and vector drawing software extended with the Continent Maps solution from the Maps area of ConceptDraw Solution Park.
Design Data Flow. DFD Library
Data flow diagram or DFD is a type of diagrams used for graphical representation the "flow" of data through an information system, for effective modeling its process aspects and for visualization the data processing. They are one of the best tools for clearly making an overview of the system that will be developed, for depiction in details what kinds of information will be inputted to the system and outputted from it, where they will be stored, and other details. ConceptDraw DIAGRAM software with Data Flow Diagrams solution from Software Development area of ConceptDraw Solution Park is powerful in a field of designing the DFDs. Three libraries containing 49 vector DFD shapes and symbols are offered by Data Flow Diagrams (DFD) solution. Use them to design data flow diagrams, information flow diagrams, data flowcharts, data process diagrams, structured analysis diagrams, to create the data-oriented models or process-oriented models, and so on. Pay also attention for the included collection of DFD samples, examples and built-in templates at ConceptDraw STORE.Network Topologies
Network topology is a topological structure of computer network, which can be physical or logical. The physical topology depicts location of different computer network elements such as computers, cables and other devices. The logical topology visually displays network dataflows from one device to another. Sometimes network logical and physical topologies can be the same. ConceptDraw DIAGRAM diagramming and vector drawing software is powerful for drawing network maps and network topologies diagrams of any kinds and complexity thanks to the Computer Network Diagrams solution from the Computer and Networks area. ConceptDraw STORE proposes collection of network icons libraries and a lot of Network Topology Diagram examples, samples and templates which were created at ConceptDraw DIAGRAM software specially for Computer Network Diagrams solution. There are six basic types of the network topologies: Bus, Star, Ring, Mesh, Tree, Fully Connected. You can fast and easy design professional-looking diagram for each of them using the ConceptDraw DIAGRAM tools. There are plenty of web Visio-like diagramming software available. Web based diagrams software can be powerful, but sometimes it is essential to have desktop software. One of the most advanced diagrams tools like Visio for Mac OS is ConceptDraw DIAGRAM app.
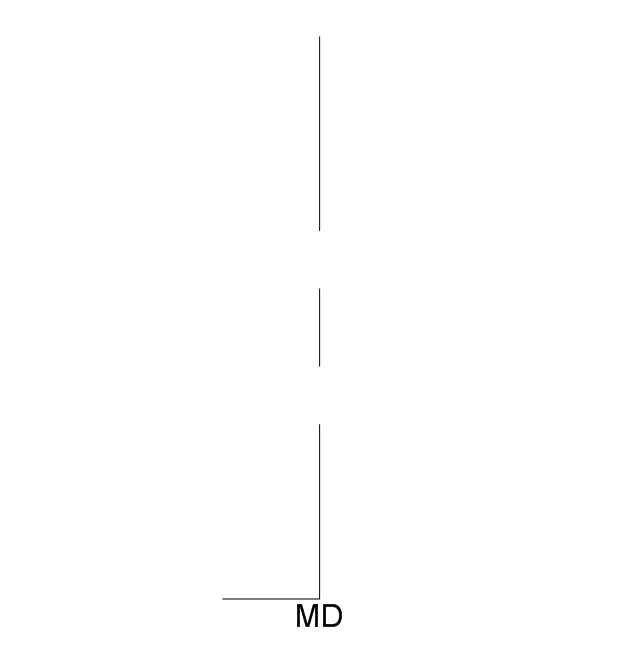
- Duct Offset Diagrams
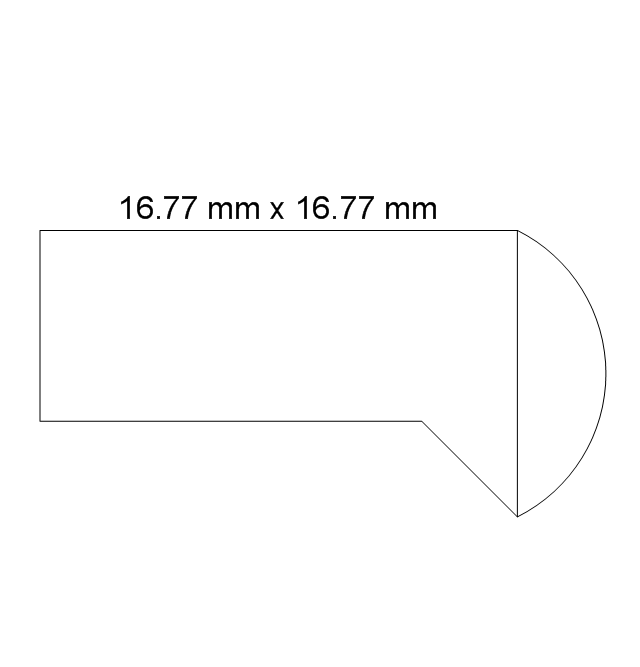
- Offset transition, rect. to rect.
- Process ( offset )
- HVAC ductwork - Vector stencils library | Design elements - HVAC ...
- Map of Australia depicting time zones offsets from UTC by state ...
- HVAC ductwork - Vector stencils library | Welding - Vector stencils ...
- How To Do A Mind Map In PowerPoint | Metro Map | SWOT Analysis ...
- Accounting Flowcharts | Purchase Process Flow Chart. Accounting ...
- Yourdon and Coad Diagram | DFD (Yourdon and Coad) template ...
- Flowcharts in PowerPoint | Flow chart Example. Warehouse ...
- Purchasing Flowchart
- Cross-Functional Flowchart | Purchasing Flowchart - Purchase ...
- What is the Accounting Cycle? | Workflow to Make a Purchase ...
- Purchase Process Flow Chart. Accounting Flowchart Example ...
- Four Dimensions Bubble Plot | Bubble Plot | Basic Diagramming ...
- Flowchart Purchasing
- Purchasing Flowchart Example
- Purchase Flow
- How to Create Presentation of Your Project Gantt Chart | PM Teams ...
- Design elements - HVAC ductwork | HVAC ductwork - Vector ...




















-dfd,-yourdon-and-coad-notation---vector-stencils-library.png--diagram-flowchart-example.png)
