Beauty of Event-driven Process Chain (EPC) diagrams

Comparing ConceptDraw DIAGRAM to Omnigraffle

Spider Chart Template

ConceptDraw DIAGRAM Compatibility with MS Visio

ConceptDraw DIAGRAM : Able to Leap Tall Buildings in a Single Bound

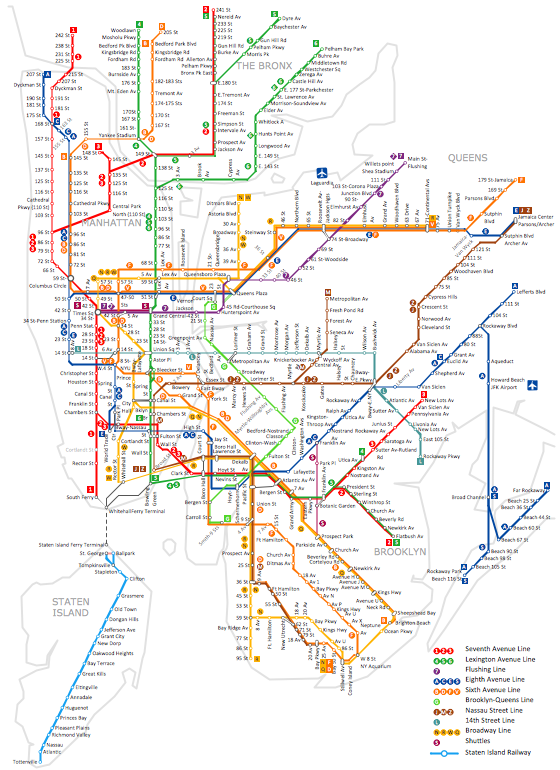
How to draw Metro Map style infographics? (New York)
Relative Value Chart Software

Biology Symbols
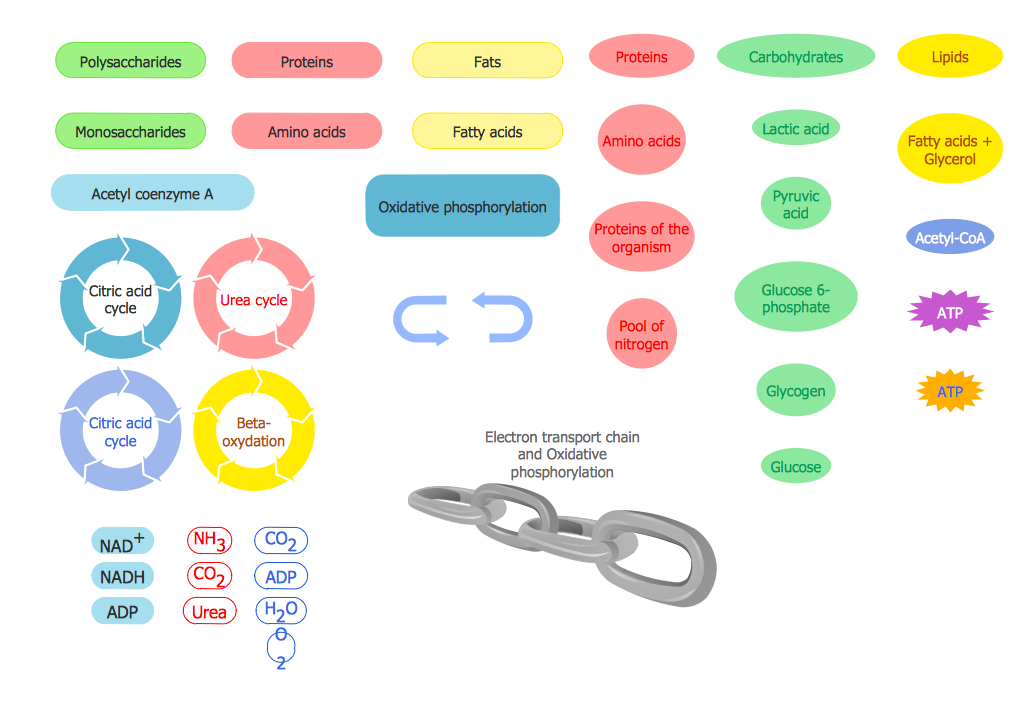
Biology solution provides 3 libraries with large quantity of vector biology symbols: Biochemistry of Metabolism Library, Carbohydrate Metabolism Library, Citric Acid Cycle (TCA Cycle) Library.
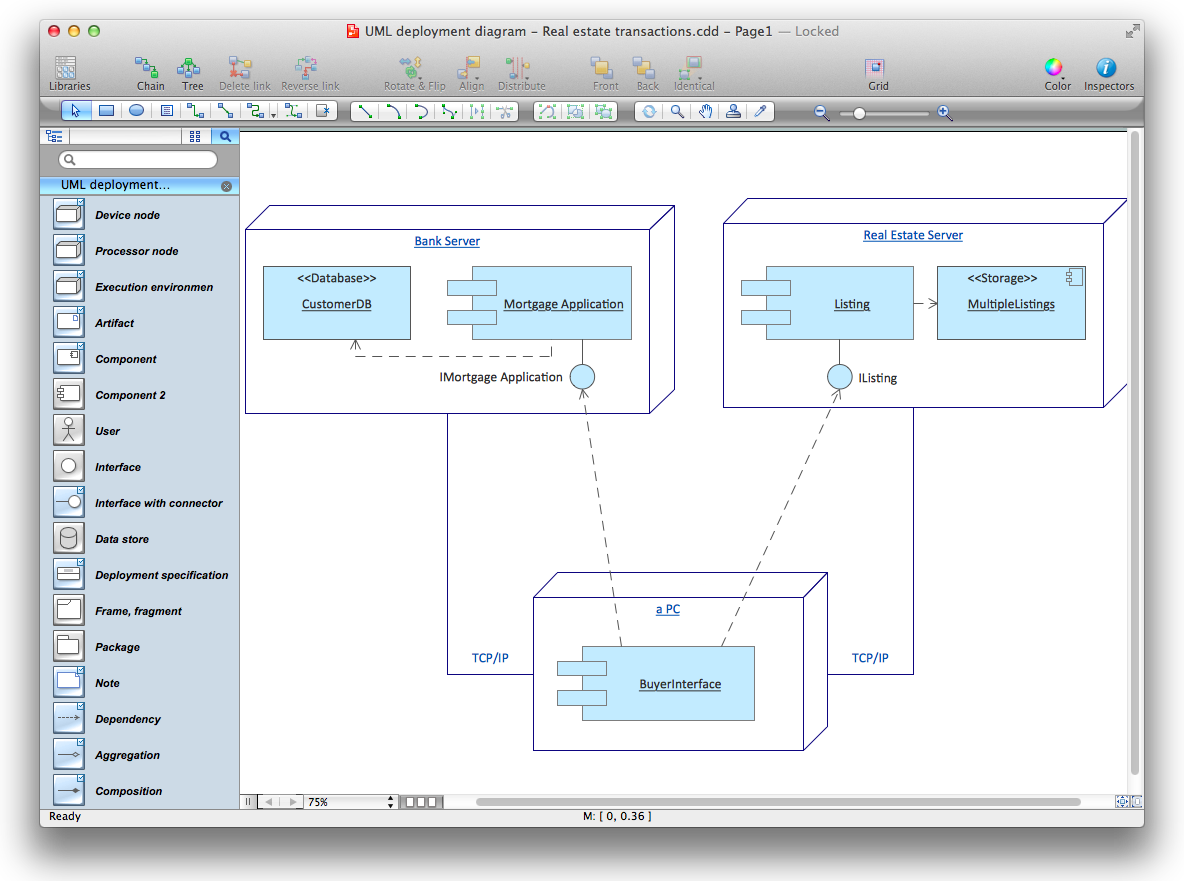
UML Deployment Diagram. Diagramming Software for Design UML Diagrams

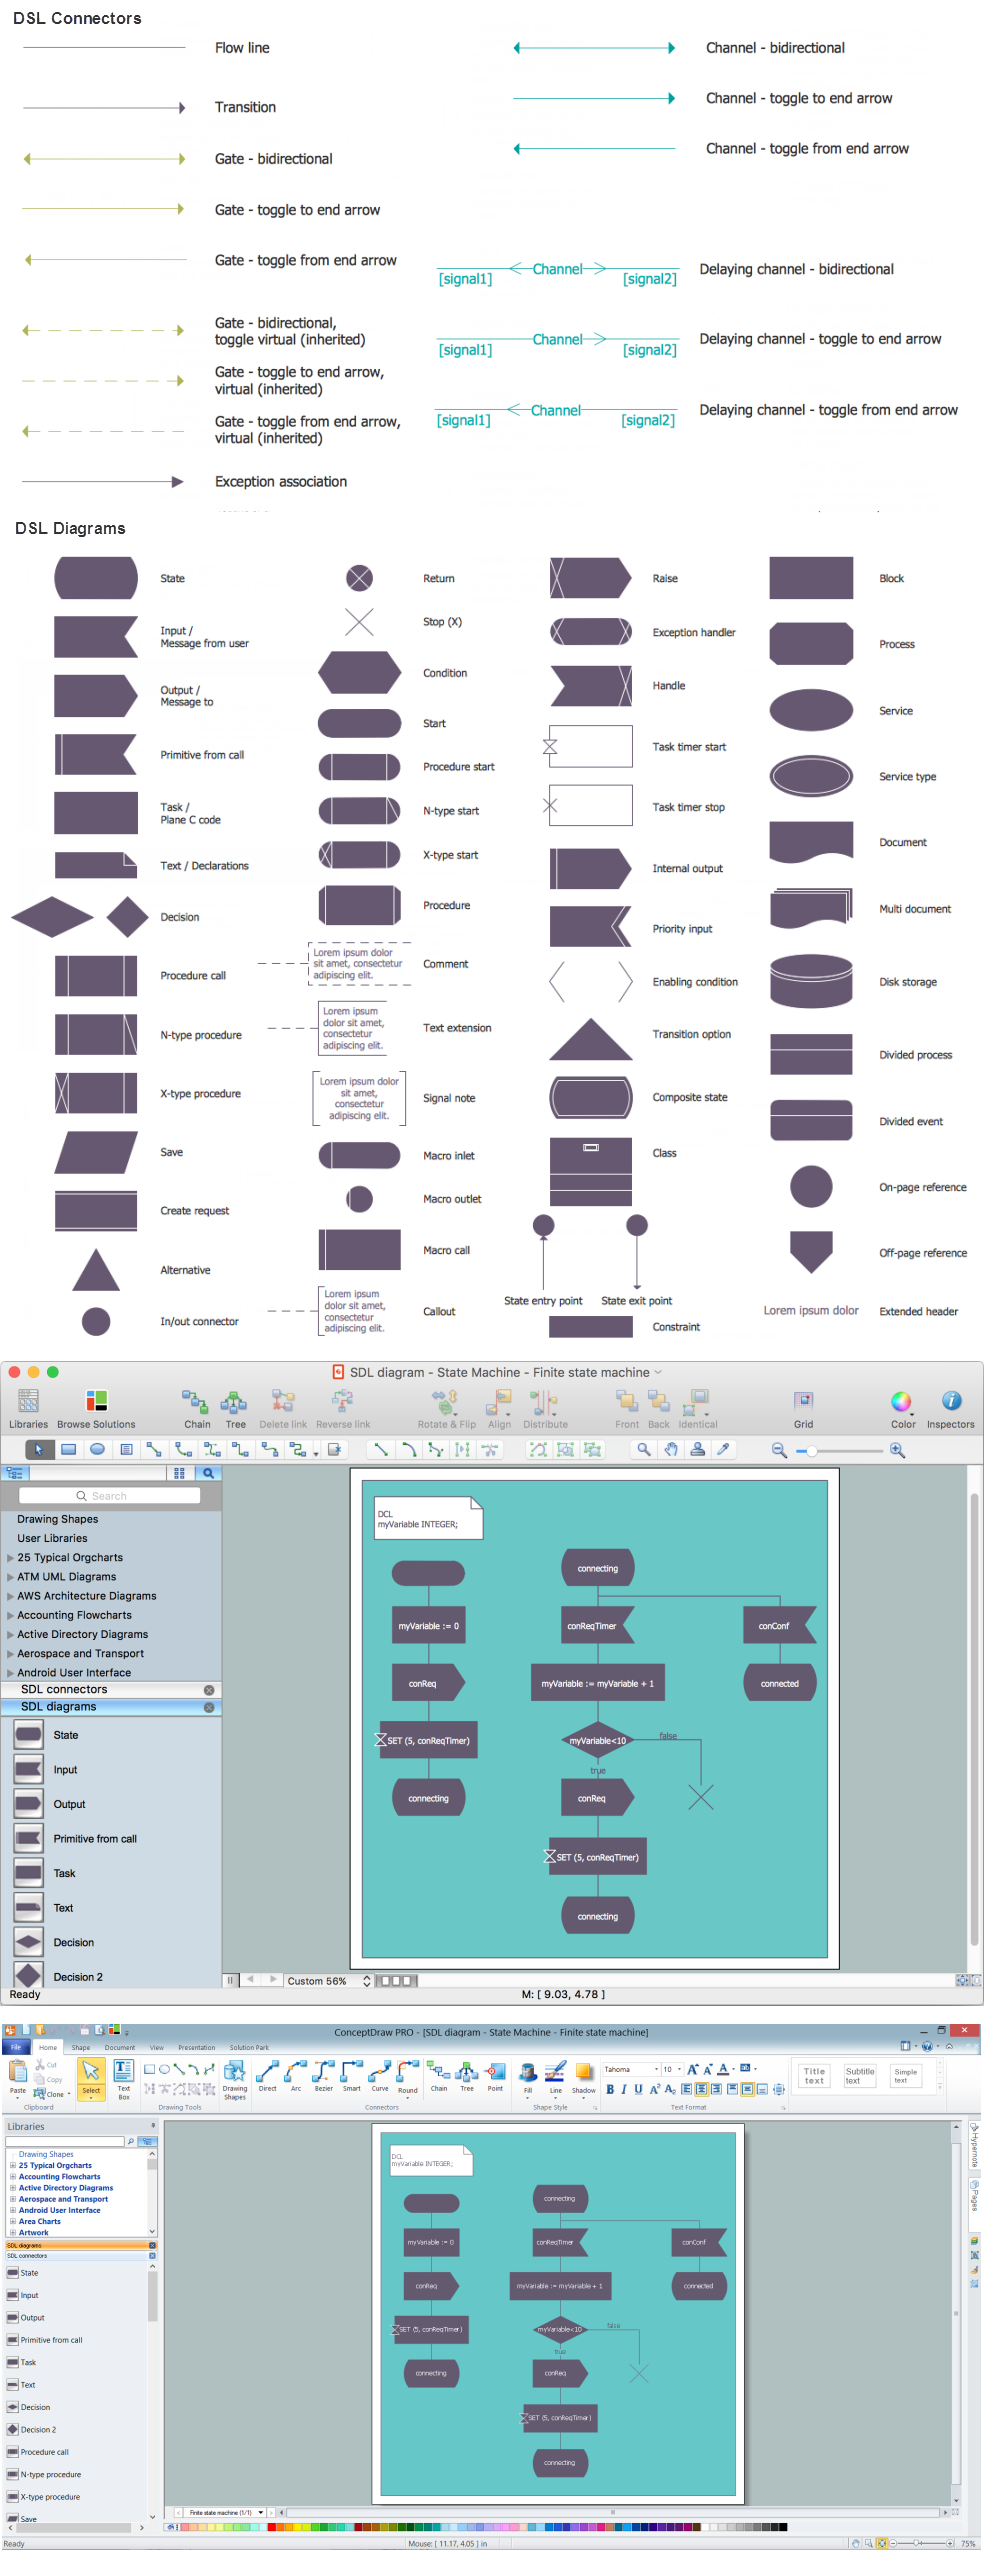
Finite State Machine
- Omnigraffle Stencils Free
- Omnigraffle Timeline Stencil
- Omnigraffle Erd Stencil
- Flowchart Software | Comparing ConceptDraw PRO to Omnigraffle ...
- Process Flowchart | Comparing ConceptDraw PRO to Omnigraffle ...
- Omnigraffle Electrical Stencils
- ConceptDraw PRO 9 Comparison with Omnigraffle Professional and ...
- Comparing ConceptDraw PRO to Omnigraffle | How to Create a ...
- Audit failure - Fault tree analysis diagram | Comparing ConceptDraw ...
- Omnigraffle Circle Outline Vector