 Stakeholder Onion Diagrams
The Stakeholder Onion Diagram is often used as a way to view the relationships of stakeholders to a project goal. A basic Onion Diagram contains a rich information. It shows significance of stakeholders that will have has influence to the success achieve
How To Create Onion Diagram
An onion diagram is a kind of chart that shows the dependencies among parts of an organization or process. The chart displays items in concentric circles, where the items in each ring depend on the items in the smaller rings. The Onion Diagram is able to show layers of a complete system in a few circles. But how to create Onion Diagram? Now, it's very easy thanks to the ConceptDraw PRO diagramming and vector drawing software extended with Stakeholder Onion Diagrams Solution from the Management Area of ConceptDraw Solution Park.Stakeholder Onion Diagrams
The Stakeholder Onion Diagram is a popular and widely used way to view the relationships of stakeholders to a project goal. The Onion Diagram focuses on the project goal, most of other diagram styles focus on the project, stakeholders, and timeline. This difference favorably distinguishes and separates the Onion Diagram from other types of diagrams. Design fast and easy Stakeholder Onion Diagrams of any complexity in ConceptDraw PRO diagramming and vector drawing software using the powerful tools of Stakeholder Onion Diagrams Solution from the Management Area of ConceptDraw Solution Park.Onion Diagram Maker
The onion diagram is a type of diagram which shows the dependencies among parts of an organization or process. The items are displayed at the concentric circles, where the items at the bigger rings depend on the items at the smaller rings. ConceptDraw PRO diagramming and vector drawing software extended with Stakeholder Onion Diagrams Solution from the Management Area of ConceptDraw Solution Park is a professional Onion Diagram Maker.Matrix Organization
Different organizations have different organizational structures. Matrix organization is one of the most popular and widely used type of organizational structure. Use ConceptDraw PRO diagramming and vector drawing software extended with 25 Typical Orgcharts solution from the Management area of ConceptDraw Solution Park for fast and easy designing matrix organizational chart for your company.
 Presentation Exchange
This solution extends ConceptDraw MINDMAP software with the ability to import presentations from Microsoft PowerPoint, as well as enhancing its existing presentation capabilities.
 Target and Circular Diagrams
This solution extends ConceptDraw PRO software with samples, templates and library of design elements for drawing the Target and Circular Diagrams.
Fishbone Problem Solving Tool
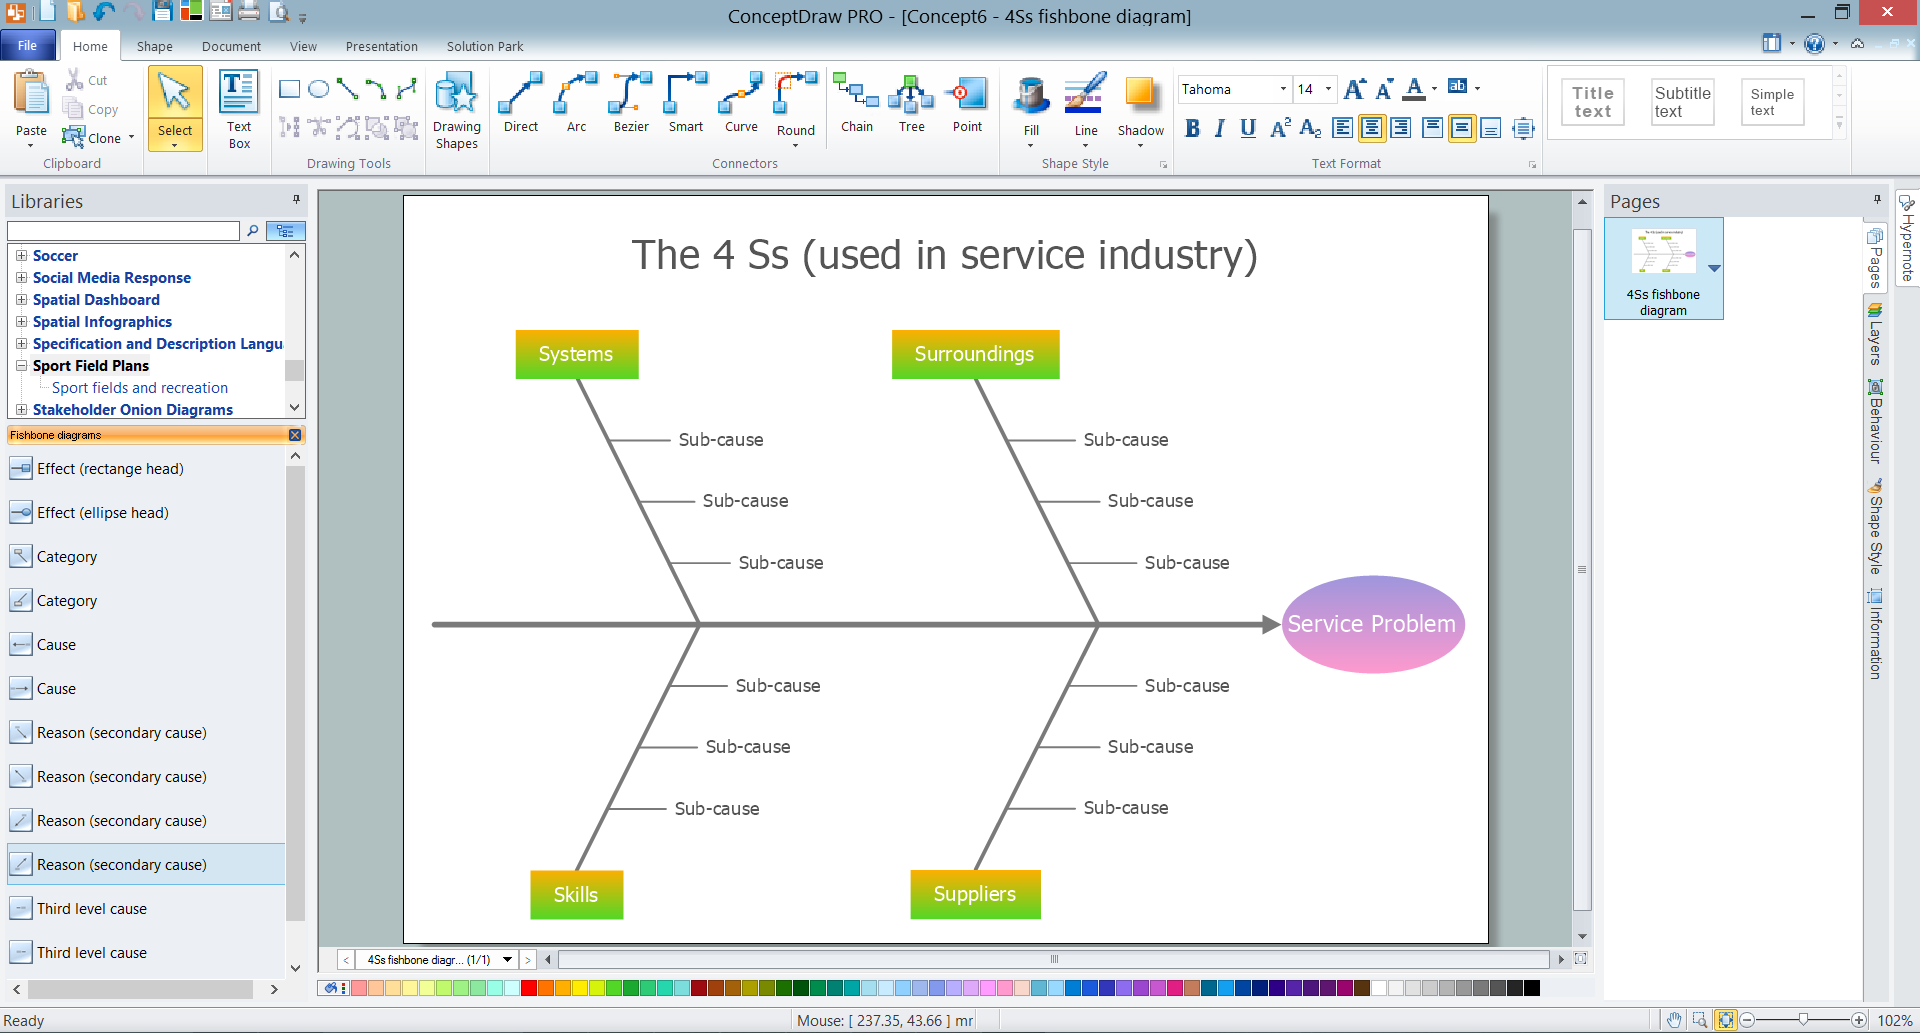
Fishbone diagram, often reffered as Cause and Effect diagram or Ishikawa diagram, is one of the basic and the most effective tools for problems solving. It is a way of graphical identifying, structuring and exploration the root causes of a problem for determining effective decision. ConceptDraw PRO enhanced with Fishbone Diagrams solution is a professional fishbone problem solving tool which helps you draw Business Productivity diagram, Cause and Effect, Fishbone, Ishikawa Diagrams to solve problems at your business.
 Basic Circle-Spoke Diagrams
Basic circle-spoke diagrams are well suited for marketing, management documents, and presentations.
Create Organizational Chart
CSOdessa team is happy to provide cost effective Organizational Chart Software for companies of any size. It is a ConceptDraw PRO extended with Organizational Charts Solution from the Management Area. ConceptDraw PRO organizational chart professional software allows quickly create organizational charts, flow charts, time lines, and much more. Use it for drawing organizational chart for any size company and analyzing organizational structure. Use ConceptDraw to create organizational chart, visualize company Organizational chart, hospital Organizational chart, hotel Organizational chart, corporate organizational chart, etc.- Cyber Security Degrees | Stakeholder Onion Diagrams ...
- Research onion diagram | Stakeholder Onion Diagrams | Research ...
- Stakeholder Onion Diagrams | ConceptDraw Solution Park ...
- Cyber Security Degrees | Stakeholder Onion Diagrams ...
- Stakeholder Onion Diagrams | Target and Circular Diagrams | Basic ...
- The Research Onions
- Target and Circular Diagrams | Research cycle - Circle diagram ...
- Process Flowchart | Structured Systems Analysis and Design ...
- How To Create a MS Visio Telecommunication Network Diagram ...
- Cafe performance metrics vs. air temperature - Visual dashboard ...
- Fishbone Diagram Powerpoint Template
- Process Flowchart | Best Program to Make Workflow Diagrams ...
- Stakeholder Onion Diagrams | Network Diagram Software LAN ...
- A Research Analysis Diagram
- Draw Research Process Diagram
- Process Flowchart | Best Program to Make Workflow Diagrams ...
- Timeline Maker For Powerpoint
- Stakeholder Onion Diagrams | ConceptDraw Solution Park | Project ...
- Stakeholder Management System | Stakeholder Onion Diagrams ...
- Onion Diagram Maker | Stakeholder Management System ...


