HelpDesk
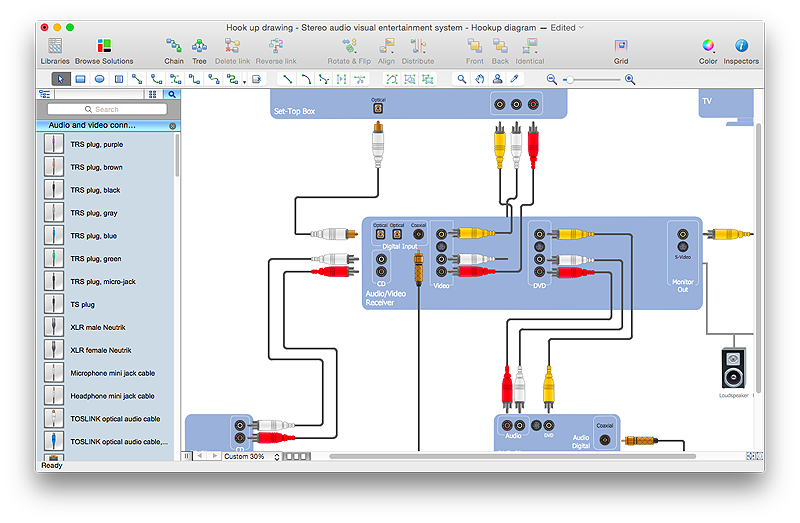
How to Create a Hook Up Diagram
Hook-up diagram of audio-video system is a detailed drawing showing the audio video connections in a correct manner so that system operates properly. Using the hook up diagram you can understand how the elements of your audio-video system should be installed. ConceptDraw PRO allows you to draw the Hook Up diagram of Audio-Video system easily using the set of special libraries provided by Audio and Video Connectors solution.HelpDesk
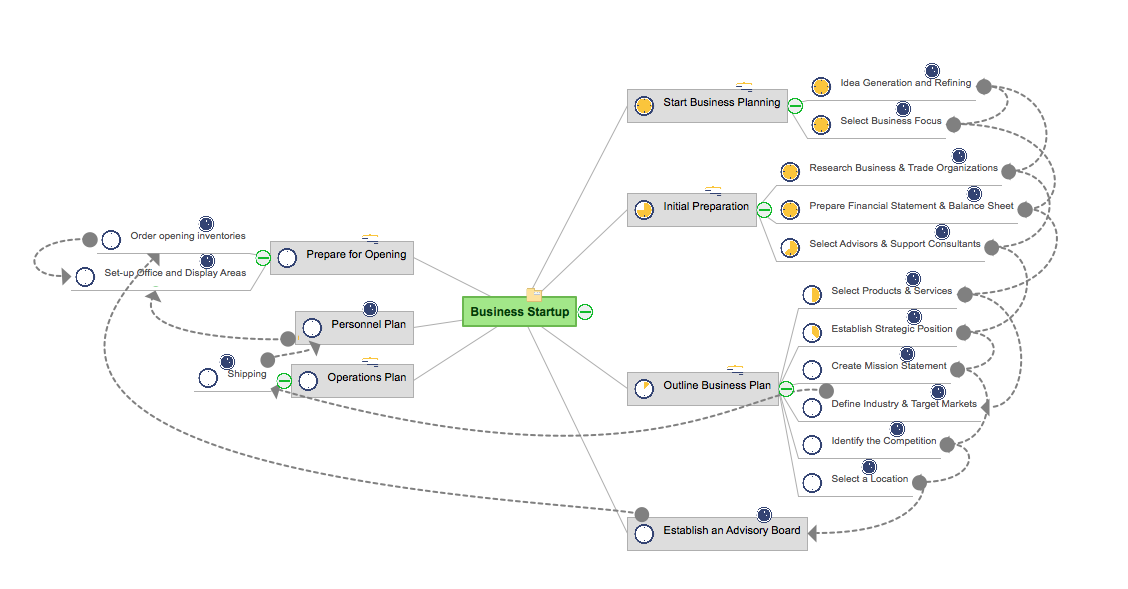
How to Make a Mind Map from a Project Gantt Chart
ConceptDraw Office allows you to see the project data from ConceptDraw PROJECT in a mind map structure by opening your project in ConceptDraw MINDMAP.
 ConceptDraw Solution Park
ConceptDraw Solution Park collects graphic extensions, examples and learning materials
HelpDesk
How to Create a Bar Chart in ConceptDraw PRO
Bar charts (bar graphs) are diagrams displaying data as horizontal or vertical bars of certain heights. Bar charts are widely used to show and compare the values of the same parameters for different data groups. The bar graph can be vertical or horizontal. This depends on the amount of categories. There are many methods in which bar graph can be built and this makes it a very often used chart type. Usually, a bar chart is created so that the bars are placed vertically. Such arrangement means that the bar's height value is proportional to the category value. Nevertheless, a bar chart can be also drawn horizontally. This means that the longer the bar, the bigger the category. Thus, a bar chart is a good way to present the relative values of different measured items. The ConceptDraw Bar Graphs solution allows you to draw a bar chart quickly using a vector library, containing the set of various bar charts objects.HelpDesk
How to Create SWOT Analysis Template Using ConceptDraw PRO
SWOT-analysis is used to develop a marketing strategy. SWOT-analysis includes determining the strengths and weaknesses in the company's activity, potential external threats and opportunities and assesses their relative strategic competitors. ConceptDraw SWOT and TOWS Matrix Diagrams solution provide a set of SWOT matrix in which should be recorded and then compared the strengths and weaknesses of the enterprise and the market opportunities and threats. This comparison allows you to determine what steps can be taken for the development of your company and what problems need to be addressed urgently.- How To Make A Chart Online
- Make A Chart Online Free
- Make Charts Online
- Make Chart Online
- Flow Chart Online | Entity Relationship Diagram Software for Design ...
- Make Pert Chart Online
- Flow Chart Online | Online Flow Chart | Program Evaluation and ...
- How To Create a PERT Chart | Example of DFD for Online Store ...
- Making A Flowchart Online
- Flow Chart Online | How To Create a PERT Chart | Flow chart ...
- Pyramid Diagram and Pyramid Chart | Online store social media ...
- Flow Chart Online | How To Create a PERT Chart | How to Create a ...
- Process Flowchart | Flow Chart Online | ConceptDraw Solution Park ...
- Online Diagram Tool | Flow Chart Online | Entity Relationship ...
- Make Dfd Online
- Workflow Online Free
- Contoh Flowchart | Flowchart | Basic Flowchart Symbols and ...
- Data Flow Diagrams | Data Flow Diagrams | Create Flow Chart on ...
- ConceptDraw Solution Park | Flow Chart Online | Online Flow Chart ...
- Flow Chart Online | Online Flow Chart | ConceptDraw Solution Park ...


