Online Diagram Tool
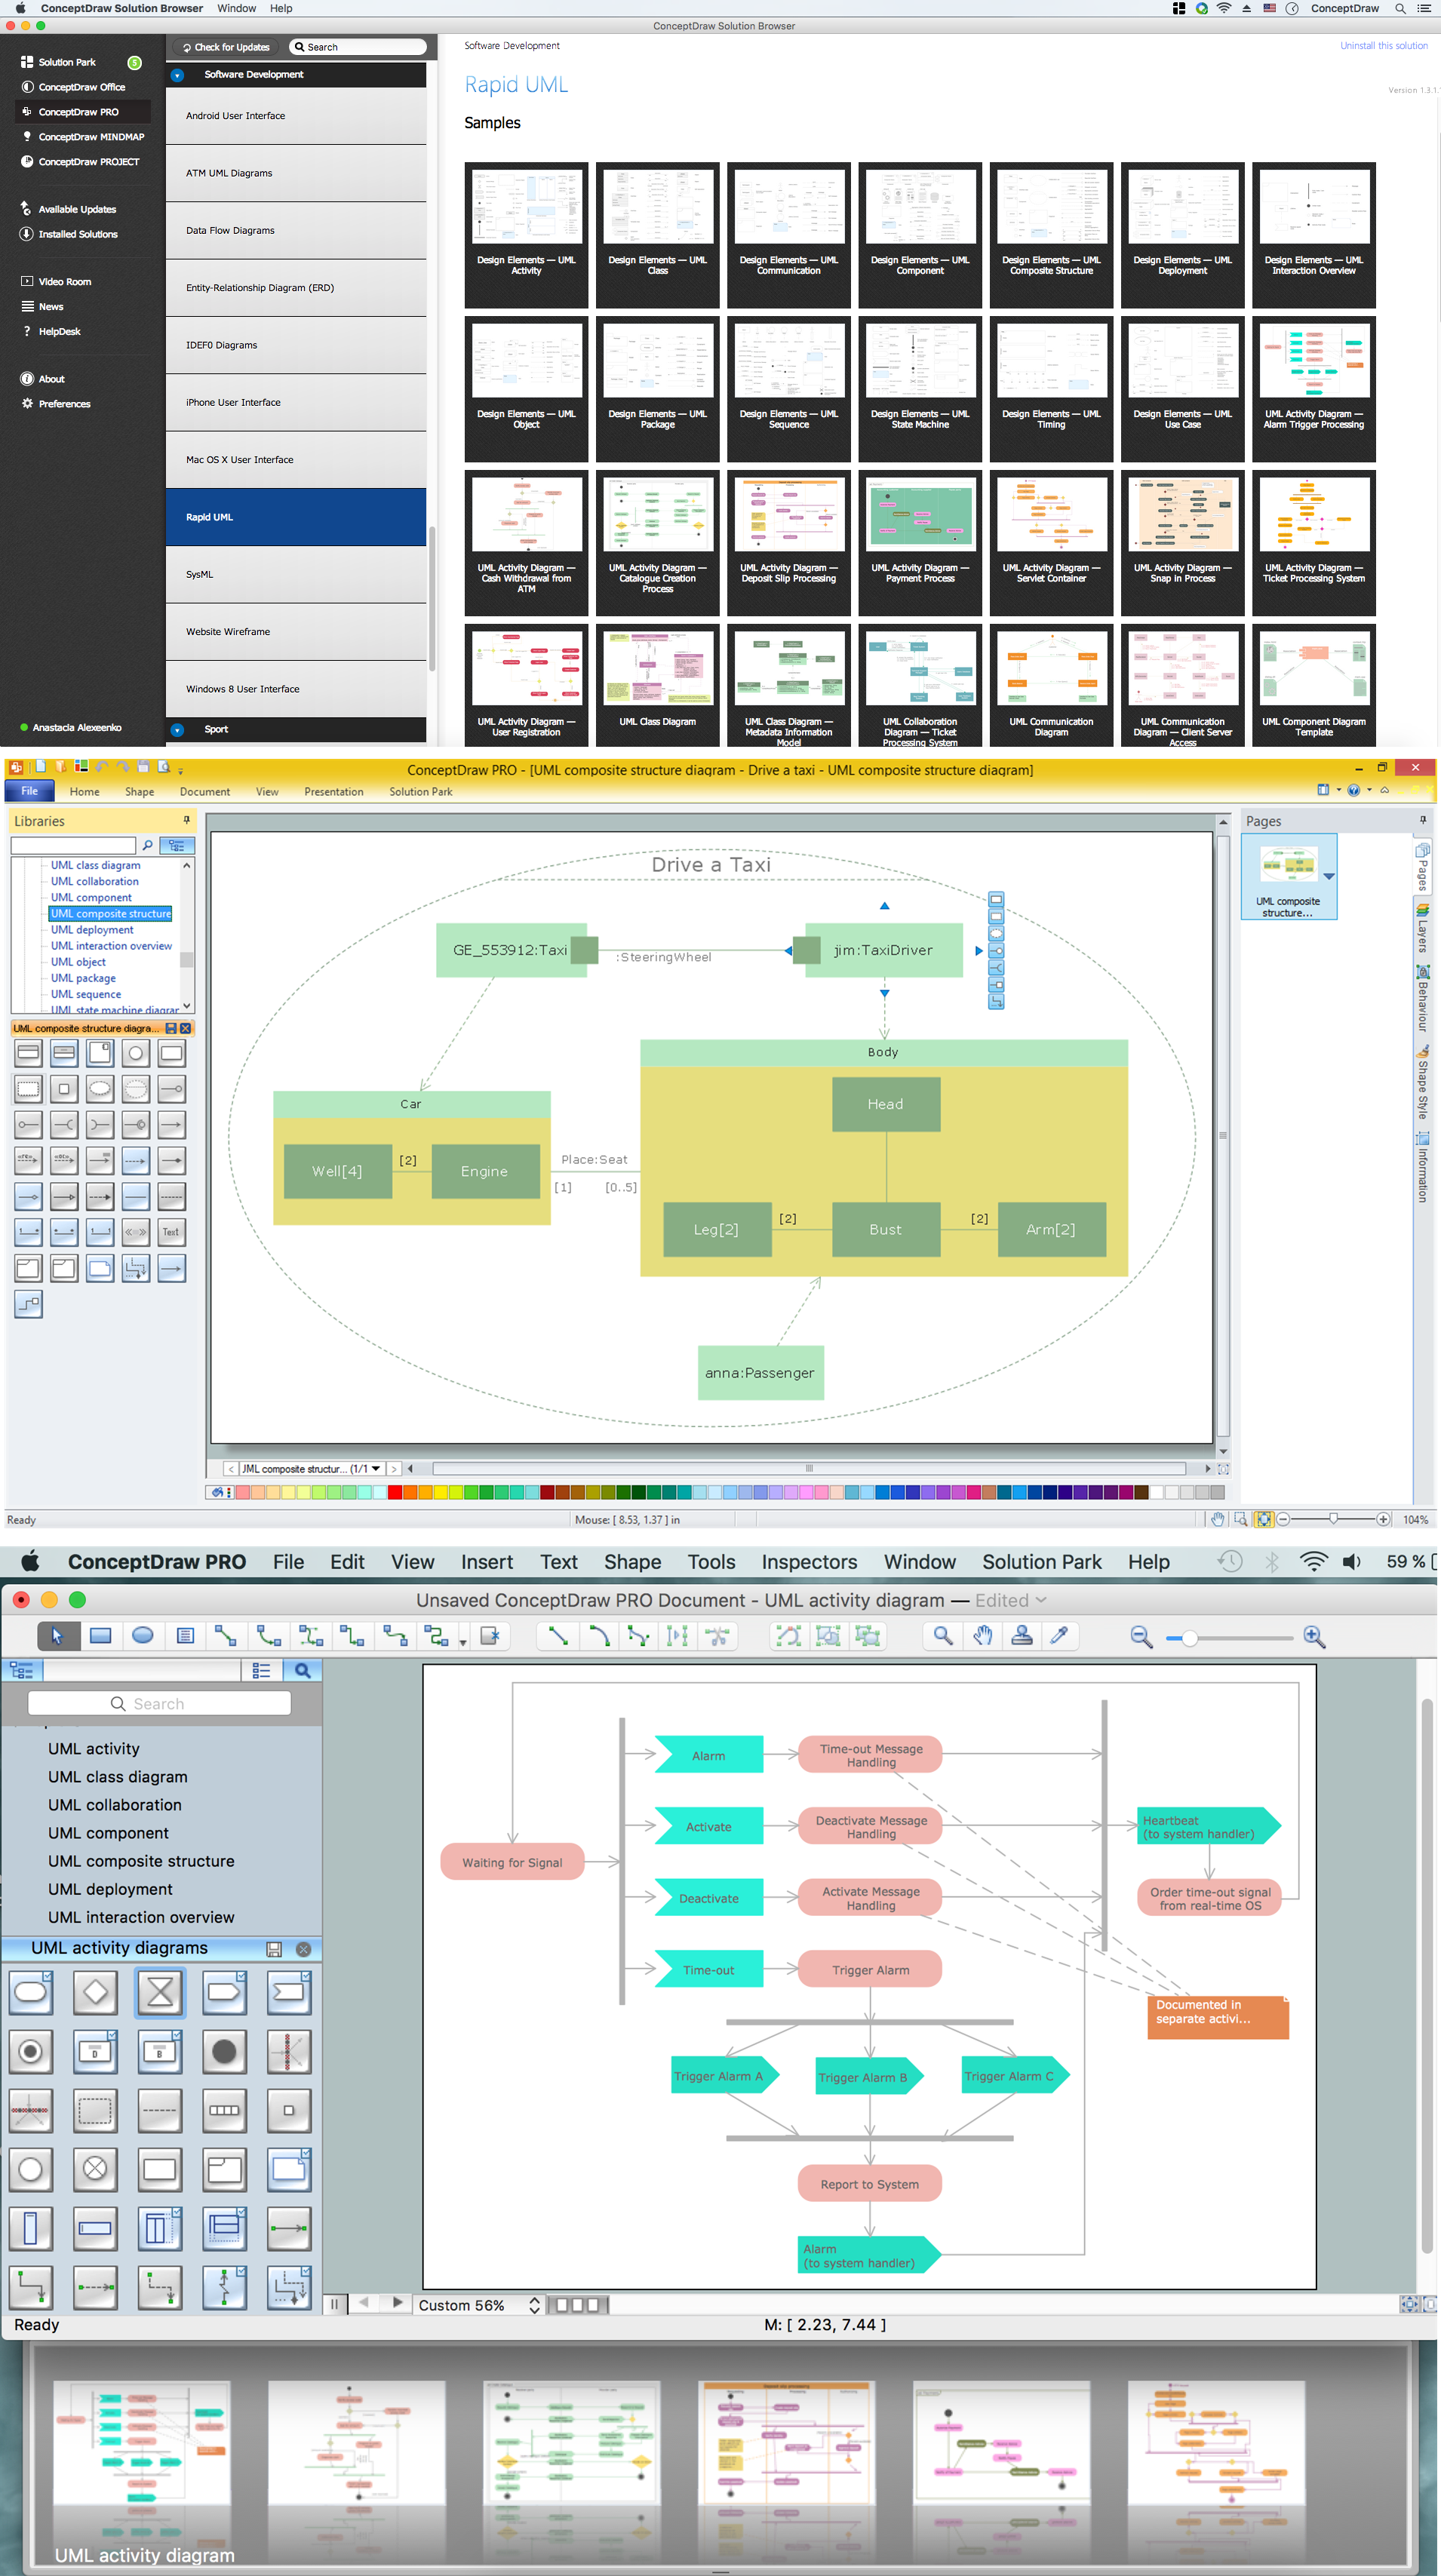
ConceptDraw DIAGRAM diagramming and vector drawing software extended with Rapid UML Solution from the Software Development Area is a powerful online diagram tool that will help you design any types of UML diagrams simply and fast.Flow Chart Online
Flow Chart is a great visualization tool for the flow of a process, algorithm or procedure with a lot of benefits. It is convenient to use a powerful software for creating flow charts. Now we have the best flow chart maker online design software - ConceptDraw DIAGRAM enhanced with Flowcharts Solution from the "Diagrams" Area of ConceptDraw Solution Park.How to create your UML Diagram
The UML diagrams in this Solution are divided into three broad categories: Structure Diagrams; Behavior Diagrams; Interaction Diagrams. The 13 diagrams contained in the Rapid UML Solution offer an essential framework for systems analysts and software architects to create the diagrams they need to model processes from the conceptual level on through to project completion.Building Drawing Software for Design Sport Fields
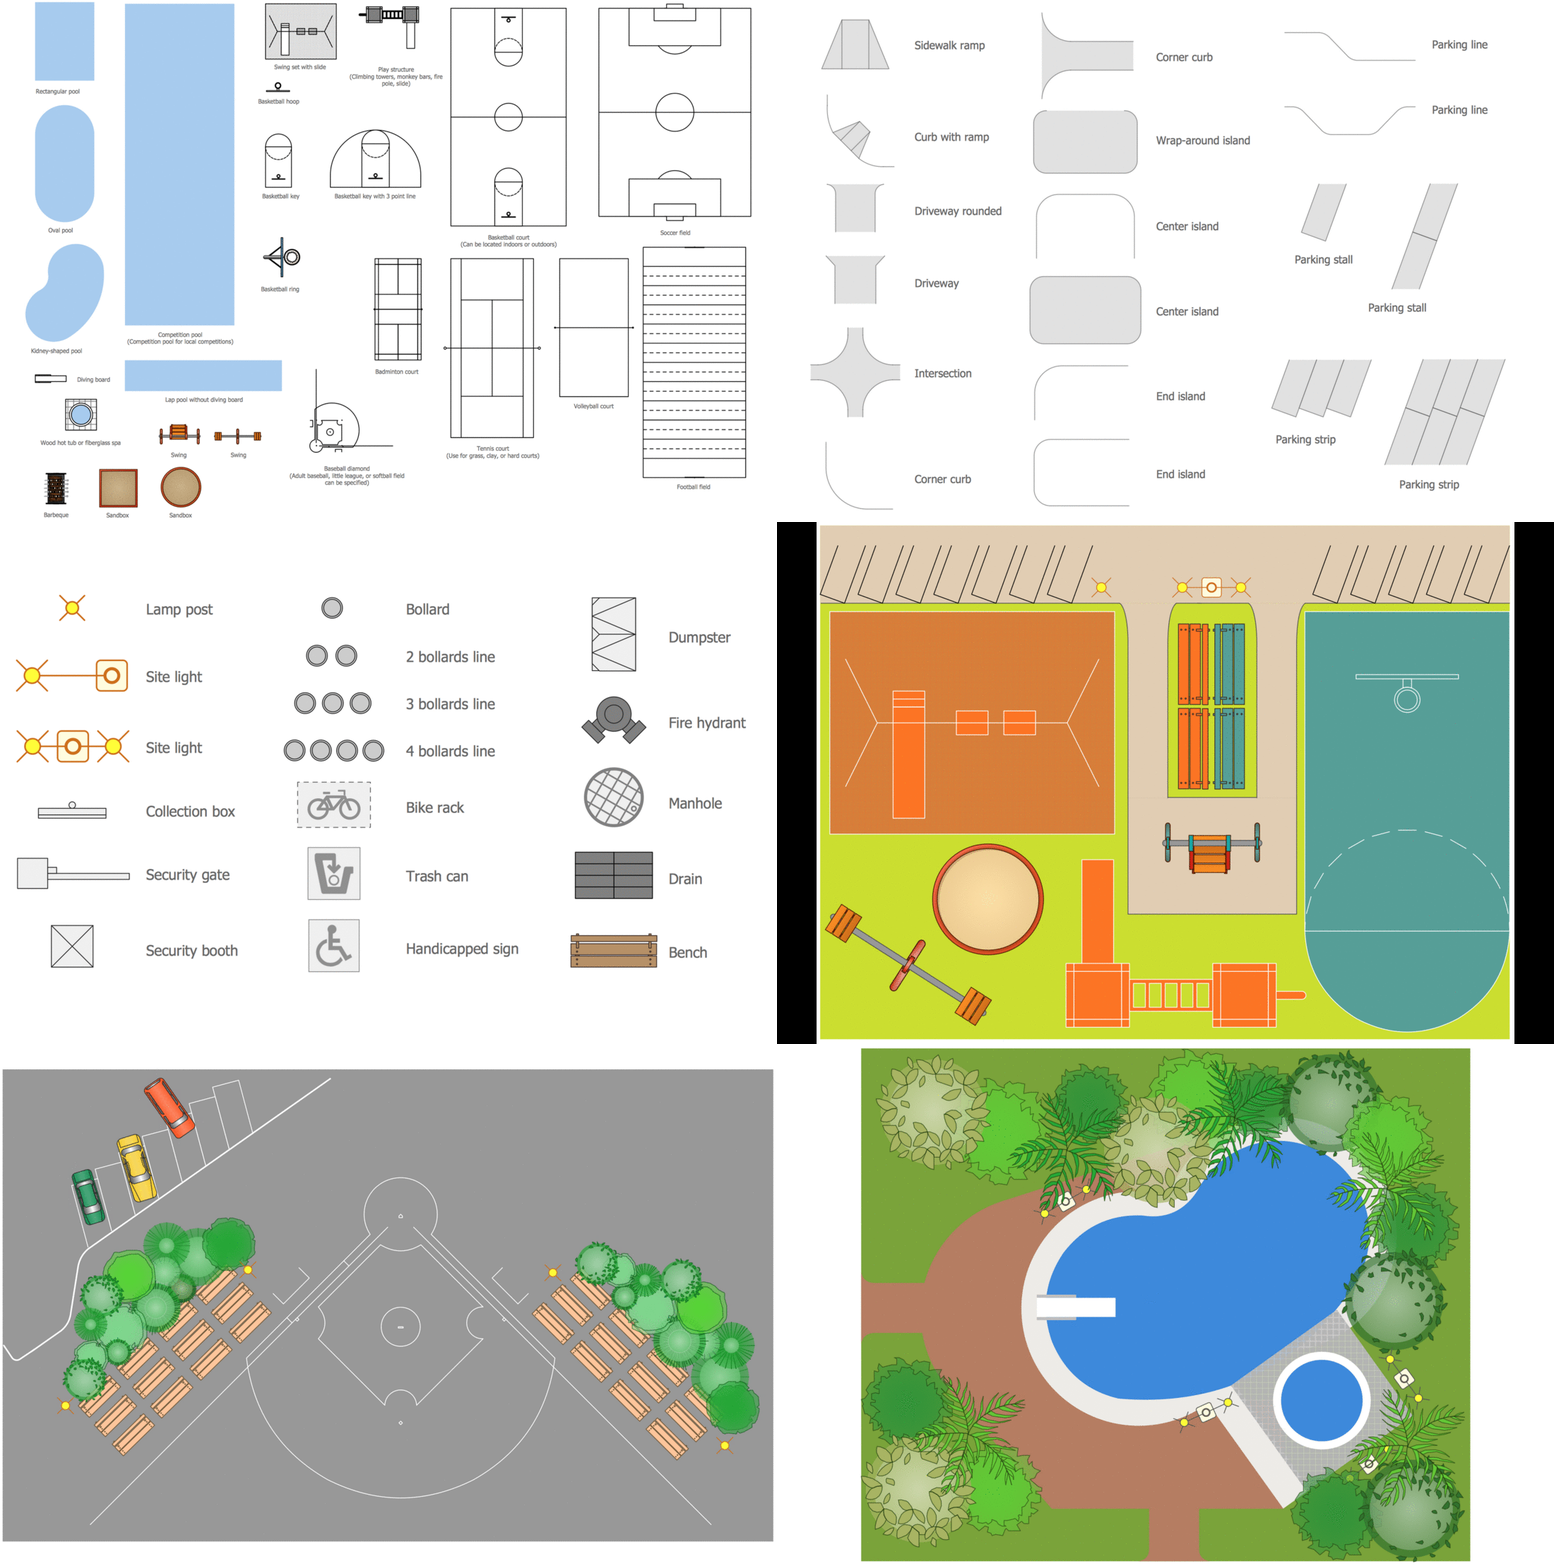
The sport fields, sport complexes, and sport grounds are popular places for all, but especially for children and teenagers who spend there a large amount of their time. So the sport fields must to be safe and carefully thought-out. Where to start and what things to consider when planning and building sport fields? First and foremost you need to take into account is that the fields for football, basketball, volleyball, tennis and other active sports differ by their dimensions, surface and design, and must to be constructed according to the rules for a given game. If the sport field assumes the presence of children of different age, you need organize the comfort staying them together. All installed elements and constructions should bring the maximum benefit and enjoyment from training. That's why the planning and construction the sport field cannot to be realized without a plan. ConceptDraw DIAGRAM building drawing software tools are perfect for design Sport Fields using the ready vector elements from the libraries of Sport Fields Plans solution from Building Plans area.
Online Marketing Objectives
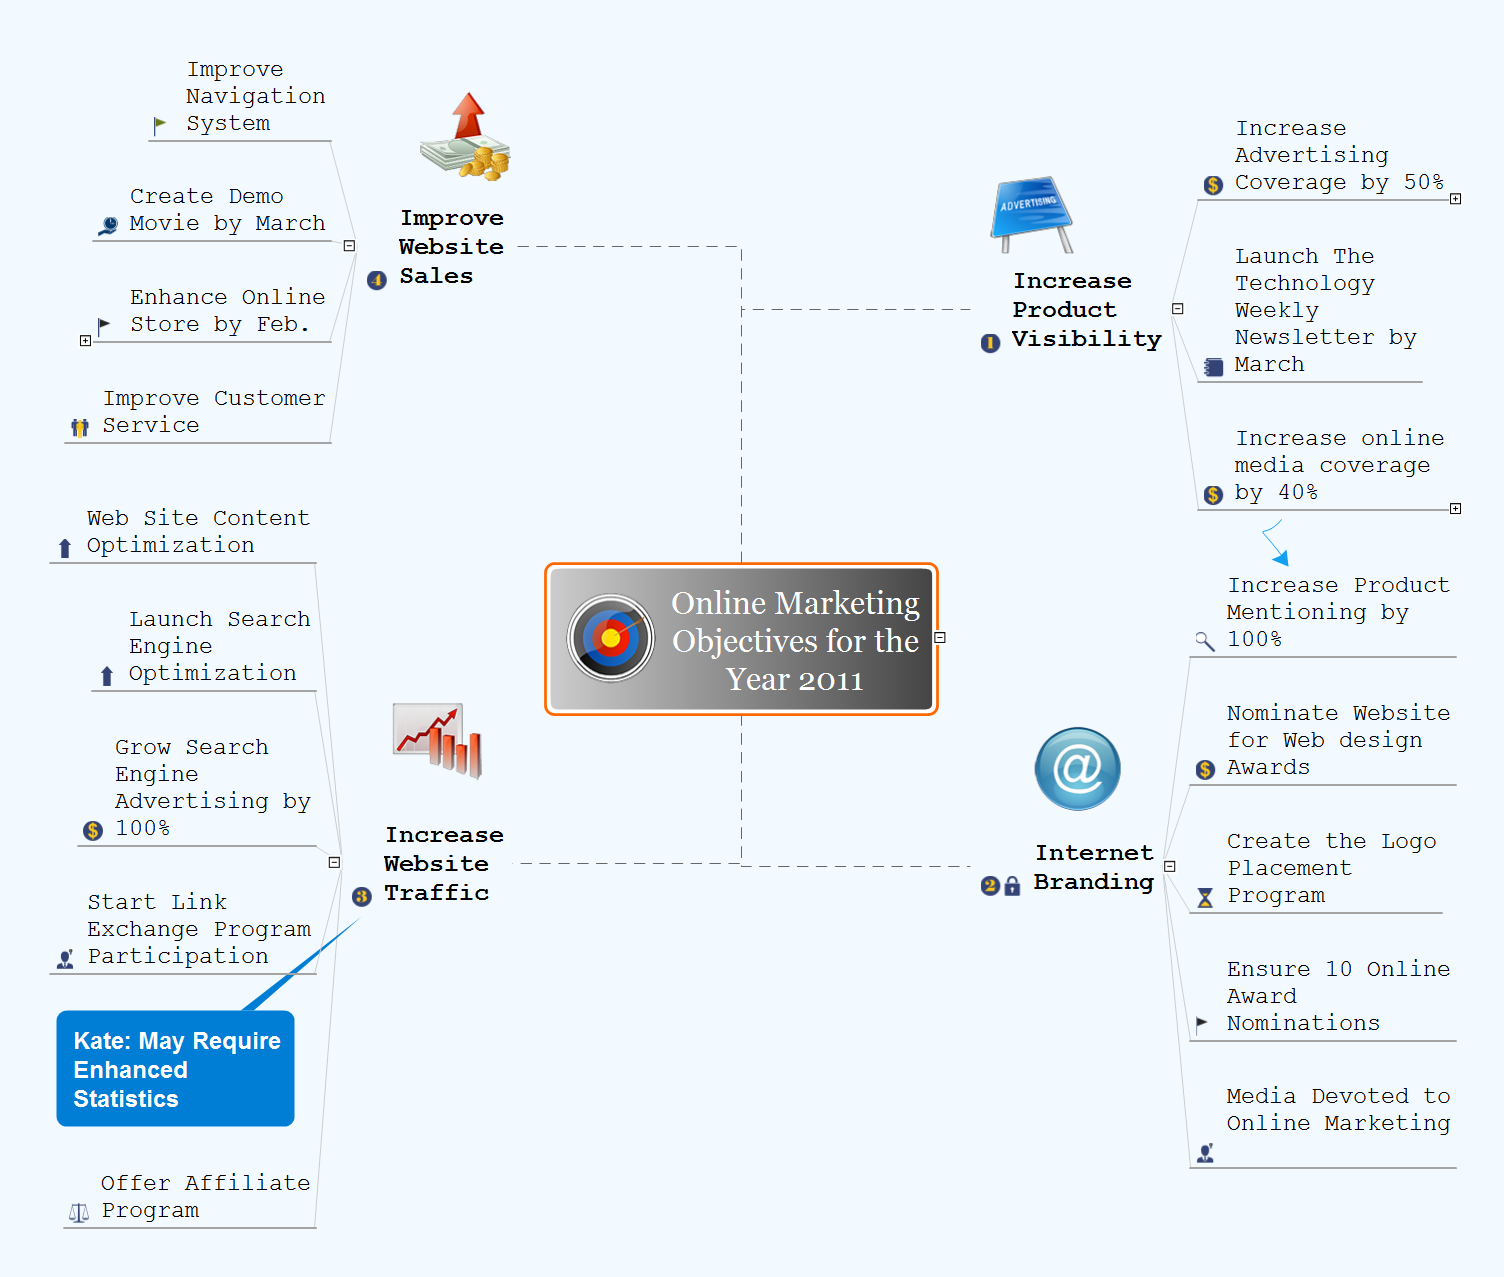
Promotion and sale of goods or services, as well as the conquest of free niche on the market in a given category include numerous methods directed on the advertising the products and attraction attention of potential buyers. Among them are traditional methods of struggle for the buyer, as well as internet marketing or online marketing, that is a complex of measures aimed at attraction of clients using the online technologies. The main tool of online marketing is a website of the company. The proper preparation and promotion of website ensure to the owner the opportunity to successfully compete with manufacturers of similar products, ensuring the high sales. Today each manufacturer, regardless of the size and direction of activities, creates a website, online store, blog, pages in social networks that give the visitors full information about the company, its products and services. Given the fact that a potential buyer spends a lot of time at the Internet, such strategy is justified and the practice shows a high efficiency of online marketing. ConceptDraw MINDMAP helps to illustrate a value of outline marketing on a Mind Map, to represent the online marketing objectives for a company and to specify the targets outlined for each of these objectives.UML Class Diagrams. Diagramming Software for Design UML Diagrams
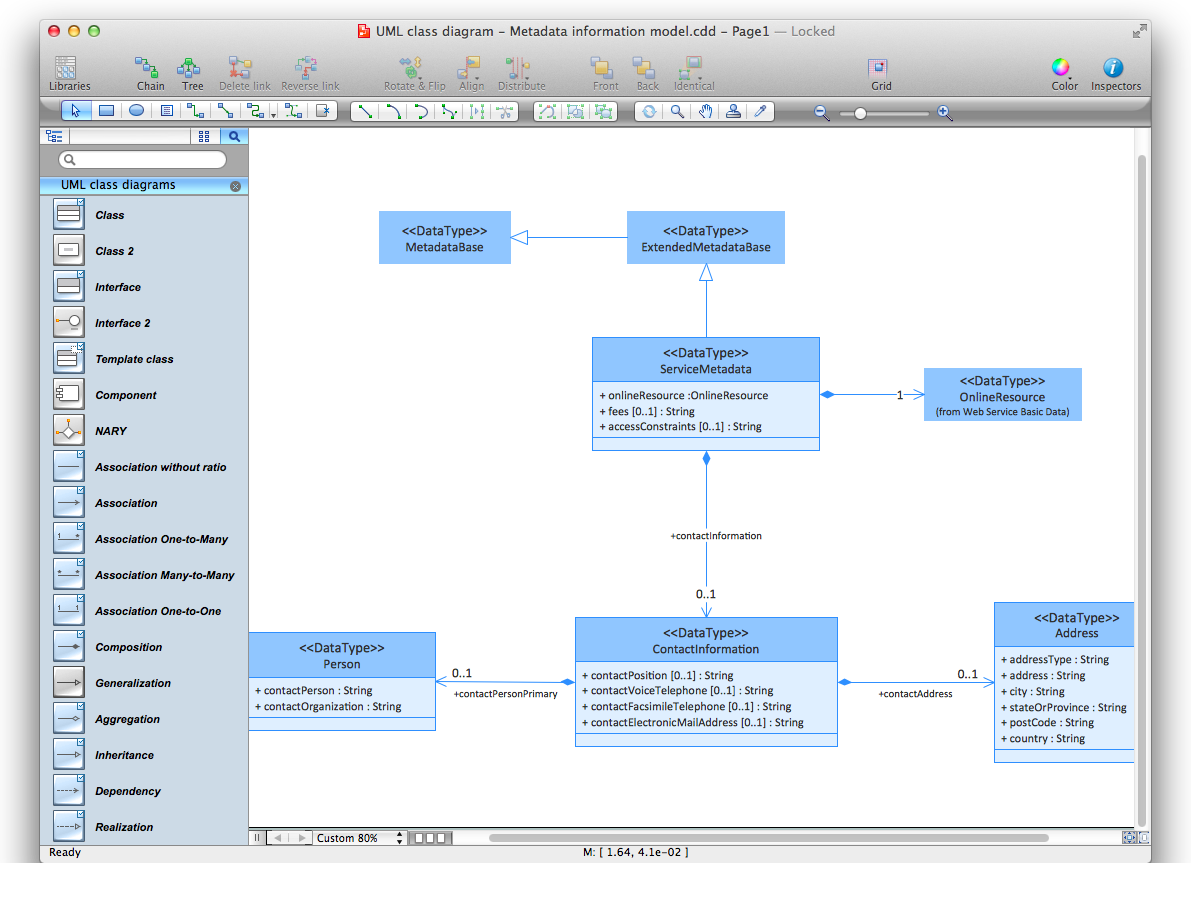
In software engineering, a UML Class Diagrams is a type of static structure diagram that is used both for general conceptual modeling of the systematics of the application, and for detailed modeling translating the models into programming code. Use ConceptDraw DIAGRAM with UML class diagram templates, samples and stencil library from Rapid UML solution to show the classes of system, their attributes, operations or methods, and the relationships among the classes.
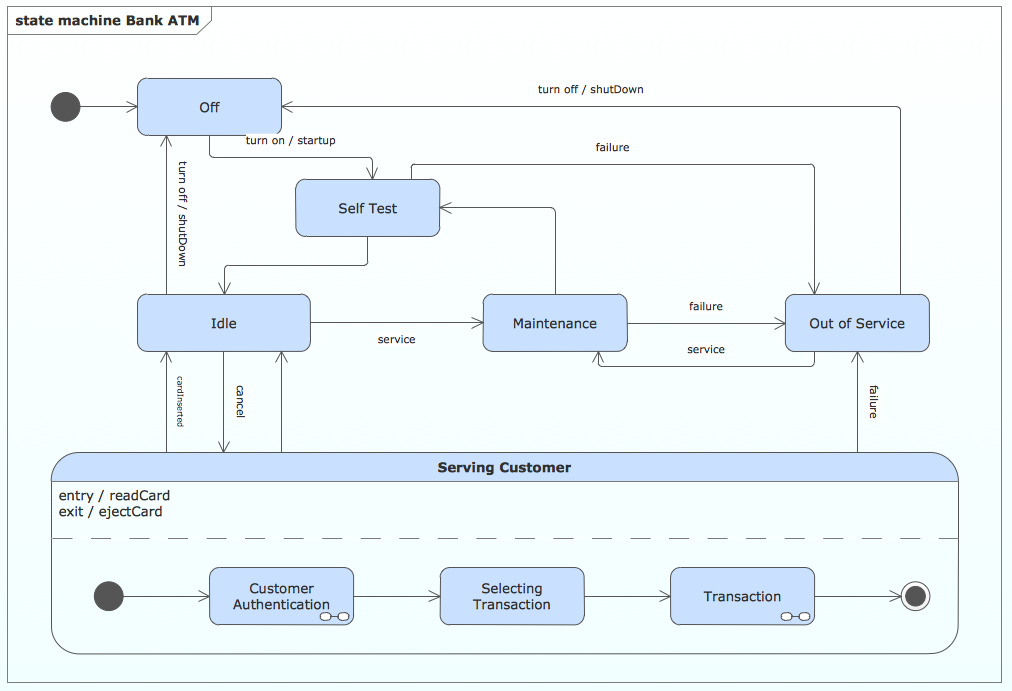
State Machine Diagram
UML state machine's goal is to overcome the main limitations of traditional finite-state machines while retaining their main benefits. ConceptDraw is ideal for software designers and software developers who need to draw UML State Machine Diagrams.
Social Media Response Management DFD Charts - software tools
ConceptDraw is your tool for driving social integration and managing change across and streamline social media processes of your organisation.This tool keeps the entire team on the same page allowing you to realize your social media strategy, improve the quality of your answers, and minimize the time it takes to respond.
Diagramming software for Amazon Web Service icon set: Storage
Storage icons - Amazon AWS pro diagrams - AWS diagrams are part of architecturing tools provided with ConceptDraw Solution Park.Example of DFD for Online Store (Data Flow Diagram)
Data Flow Diagram (DFD) is a methodology of graphical structural analysis and information systems design, which describes the sources external in respect to the system, recipients of data, logical functions, data flows and data stores that are accessed. DFDs allow to identify relationships between various system's components and are effectively used in business analysis and information systems analysis. They are useful for system’s high-level details modeling, to show how the input data are transformed to output results via the sequence of functional transformations. For description of DFD diagrams are uses two notations — Yourdon and Gane-Sarson, which differ in syntax. Online Store DFD example illustrates the Data Flow Diagram for online store, the interactions between Customers, Visitors, Sellers, depicts User databases and the flows of Website Information. ConceptDraw DIAGRAM enhanced with Data Flow Diagrams solution lets you to draw clear and simple example of DFD for Online Store using special libraries of predesigned DFD symbols.
Example of DFD for Online Store (Data Flow Diagram)
Data Flow Diagram (DFD) is a methodology of graphical structural analysis and information systems design, which describes the sources external in respect to the system, recipients of data, logical functions, data flows and data stores that are accessed. DFDs allow to identify relationships between various system's components and are effectively used in business analysis and information systems analysis. They are useful for system’s high-level details modeling, to show how the input data are transformed to output results via the sequence of functional transformations. For description of DFD diagrams are uses two notations — Yourdon and Gane-Sarson, which differ in syntax. Online Store DFD example illustrates the Data Flow Diagram for online store, the interactions between Customers, Visitors, Sellers, depicts User databases and the flows of Website Information. ConceptDraw DIAGRAM enhanced with Data Flow Diagrams solution lets you to draw clear and simple example of DFD for Online Store using special libraries of predesigned DFD symbols.
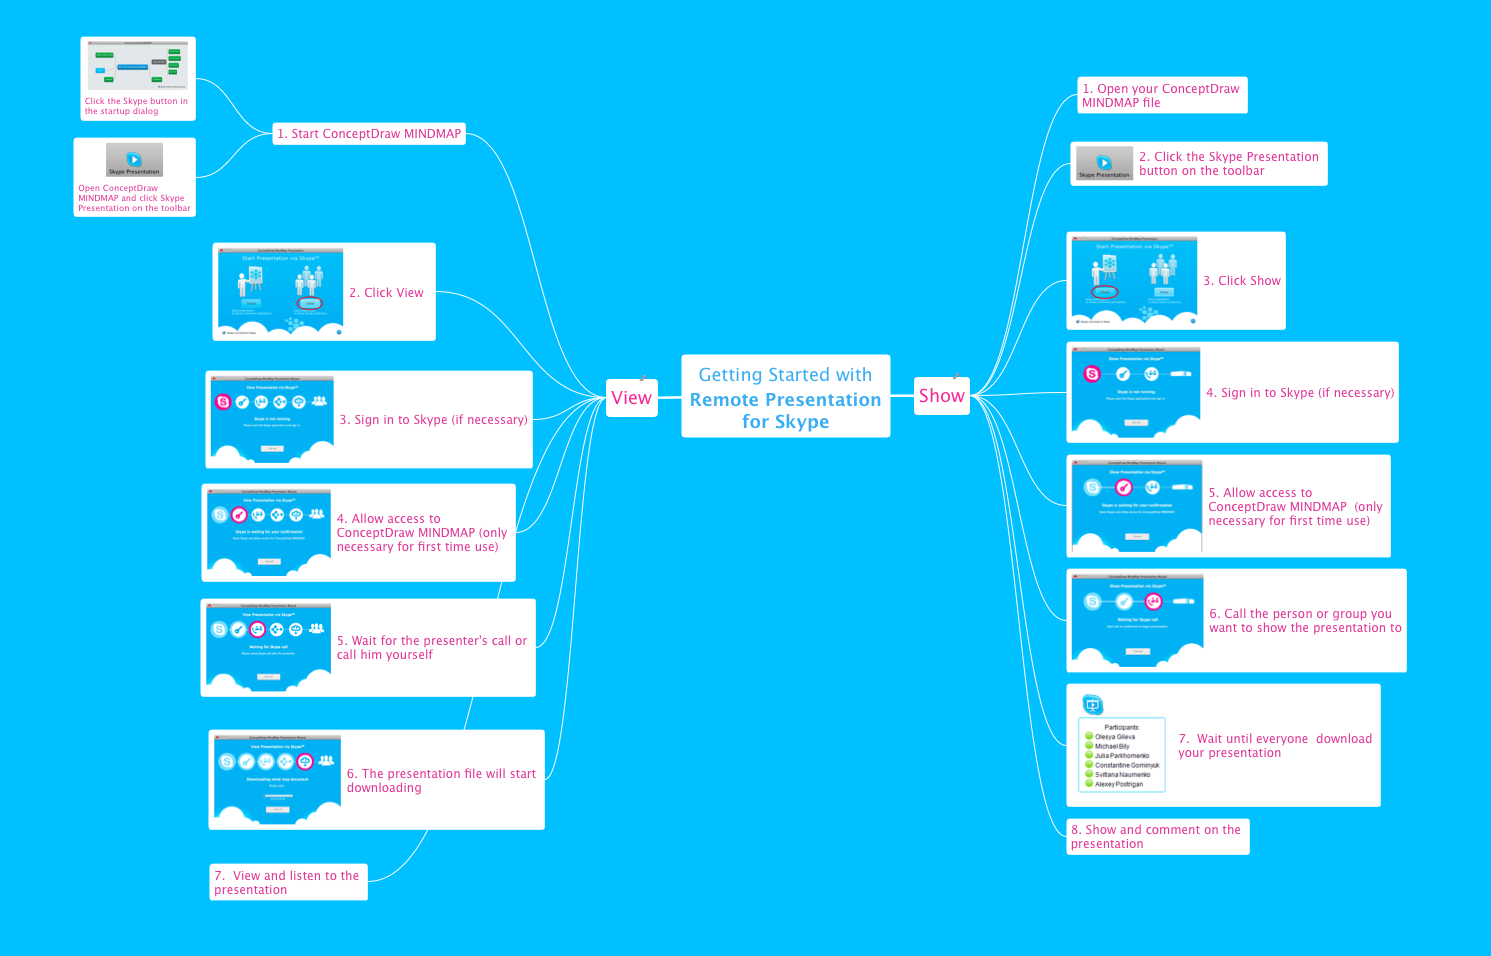
Online Collaboration via Skype
Collaborating with co-workers is very important, not only in order to get things done effectively, but also to keep in touch with the outside world. Great way for business collaboration is Skype.
How to Use the ″Online Store PR Campaign″ Sample
Interactive tool helps you find the appropriate response to social media mentions quickly.Design Element: Crows Foot for Entity Relationship Diagram - ERD
Entity-Relationship Diagram (ERD) is ideal tool that helps execute the detalization of data warehouse for a given designed system, lets to document the system's entities, attributes (objects' properties), and their interactions each other (relationships). Creation of an ERD requires the choice of specific set of notations, which the best suits for your database design. Two notations - Chen’s and Crow's Foot are applied for ERDs design. Chen's notation was developed first and has linguistic approach, the boxes represent the entities and are considered as nouns, relationships between them are shown as diamonds in a verb form. Over time Chen’s style was adapted into the popular standard - Crow’s Foot notation, where entities are shown as boxes and relationships - as labeled lines. ConceptDraw DIAGRAM software supplied with Entity-Relationship Diagram (ERD) solution offers samples and templates of ER diagrams, and also ready-to-use vector design elements - ERD Crow′s Foot and Chen's notation icons for easy designing your own ER diagrams for depicting databases.JSD - Jackson system development
Jackson System Development (JSD) is a linear method of system development created by Michael A. Jackson and John Cameron in the 1980s. It comprises the whole software life cycle directly or providing a framework for more specialized techniques. When implementing the Jackson System Development method and designing JSD diagrams, you can succesfully use the powerful and helpful tools of ConceptDraw DIAGRAM software extended with Entity-Relationship Diagram (ERD) solution from the Software Development area of ConceptDraw Solution Park.Garrett IA Diagrams with ConceptDraw DIAGRAM
Garrett IA diagrams are used at development of Internet-resources, in particulars at projecting of interactions of web-resource elements. The diagram of information architecture of the web resource which is constructed correctly with necessary details presents to developers the resource in comprehensible and visual way.How To Collaborate via Skype
Online collaboration tool for workgroups that extends Skype conference call possibilities. This professional solution makes meetings more powerful and discussions more lively. Great way to engage your audience.
Entity Relationship Diagram - ERD - Software for Design Crows Foot ER Diagrams
ER-model is a data model which lets describe the conceptual schemes in a specific subject area. It can help to highlight the key entities and specify relationships that can be established between these entities. During the database design, it is realized the transformation of ER model into certain database scheme based on the chosen data model (relational, object, network, etc.). There are used two notations for ERDs: Crow's Foot and Chen's. Crow's Foot notation proposed by Gordon Everest represents the entity by rectangle containing its name (name must be unique within this model), and relation - by the line which links two entities involved in relationship. The relationship's plurality is graphically indicated by a "plug" on the end of the link, the optionality - by a circle. Entity-Relationship Diagrams based on Crow's Foot notation can be easily drawn using the ConceptDraw DIAGRAM. Extended with Entity-Relationship Diagram (ERD) solution, it is the best ERD diagrams software with powerful tools and ready design elements for Crow's Foot and Chen notations.
Active Directory Diagram
Active Directory (AD) is a directory management service introduced by Microsoft Corporation for Windows domain networks. This service uses the Lightweight Directory Access Protocol (LDAP) and provides quick access to the included information about large structural units such as domains, organizational units, sites, and also about simple objects, such as users names with detailed information about them - contacts information, access rights, etc. Active Directory Diagram is a representation of the network structure in clear graphical format. It is a scheme of correlations of service components with preset degree of detailed elaboration. Active Directory Diagram makes the work of network administrators with Active Directory network structure more easy and convenient, allows plan and service the network quicker and more qualitatively. The help of ConceptDraw DIAGRAM software extended with Active Directory Diagrams solution from the Computer and Networks area is indispensable for easily and quickly creation the highly detailed Active Directory Diagrams.Simple Diagramming
Create flowcharts, org charts, floor plans, business diagrams and more with ConceptDraw DIAGRAM.
- Online Diagram Tool | Example of DFD for Online Store (Data Flow ...
- Online Diagram Tool | UML Flowchart Symbols | UML Deployment ...
- Online Diagram Tool | Flow Chart Online | Amazon Web Services ...
- Online Diagram Tool | Cross-Functional Flowcharts | Cross ...
- Online Diagram Tool | Online Flow Chart | ConceptDraw Solution ...
- Online Diagram Drawing Free
- Best Vector Drawing Application for Mac OS X | Online Diagram Tool ...
- Data Flow Diagram Examples | Online Diagram Tool | Data Flow ...
- Online Diagram Tool | UML Use Case Diagram Example ...
- Online Diagram Tool | Online Flow Chart | Simple Diagramming ...
- Online Diagram Tool | Diagramming Software for Design UML ...
- Manufacturing and Maintenance | Online Diagram Tool | How to ...
- | Flowchart Tool Online
- UML Deployment Diagram | State Machine Diagram | UML ...
- | Flowchart Software Free Download | Online Flowchart Creator
- Er Diagram Tool Online
- Draw Activity Diagram Online Free
- ConceptDraw PRO UML Diagrams with ConceptDraw PRO | Free ...
- UML Component Diagram Example - Online Shopping | State ...
- Component Diagram Example Ppt




_Win_Mac.png)

