Develop Scripts Exchanging Mind Maps with Evernote
How to use mind map for developing scripts. An easy way to arrange information using Evernote and mind map. Making daily plan become more convenient with this integration.Evernote + MindMapping
ConceptDraw MINDMAP and Evernote has a multitude of options for users — you can save any part of a mind map: including topics, branches, and entire maps to your Evernote.How To Create a Killer Presentation
What’s the difference between a great and bad presentation? With conceptdraw you will create only great presentations.
 Collaboration Area
The solutions from Collaboration area of ConceptDraw Solution Park extend ConceptDraw PRO and ConceptDraw MINDMAP software with features, samples, templates and vector stencils libraries for drawing diagrams and mindmaps useful for collaboration.
 Marketing
This solution extends ConceptDraw PRO v9 and ConceptDraw MINDMAP v7 with Marketing Diagrams and Mind Maps (brainstorming, preparing and holding meetings and presentations, sales calls).
How to Make SWOT Analysis in a Word Document
A SWOT Analysis is a popular tool of the strategic planning which is used to evaluate the Strengths, Weaknesses, Opportunities, and Threats that are involved in any businesses. Use of mind maps allows you to collect a lot of information used for SWOT Analysis, visually structure it and also identify the relationships between different parts of this information. SWOT and TOWS Matrix Diagrams solution for ConceptDraw Solution Park combines professional visual advantages of ConceptDraw MINDMAP software and presentation capabilities of ConceptDraw PRO, which together provide a complete work solution. The SWOT and TOWS diagrams, matrices or mind maps produced in ConceptDraw PRO using the predesigned vector objects or filling the ready templates, can be then easily exported to Microsoft Word, Microsoft Visio, Microsoft PowerPoint, Adobe PDF, and many other electronic file formats. The possibility of export makes easy the use of SWOT diagrams designed in ConceptDraw PRO and lets you efficiently collaborate even with people who maybe don't have this software.
 Target and Circular Diagrams
This solution extends ConceptDraw PRO software with samples, templates and library of design elements for drawing the Target and Circular Diagrams.
 MindWave for SAP Streamworks
ConceptDraw MindWave for SAP StreamWork allows you to visualize the process of collaboration, increase effectiveness of team work, prepare supporting presentations and achieve ready-to-use documents.
HelpDesk
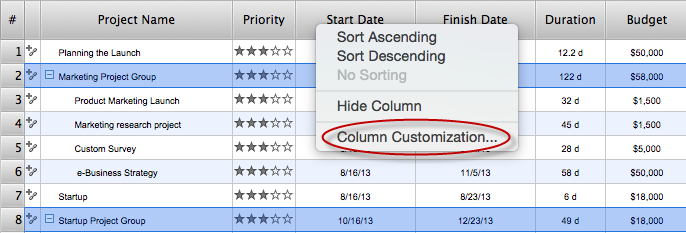
What Information to be Displayed in the ConceptDraw PROJECT Gantt Chart View
What information can can contain the project task list? Gantt Chart view is a graphical representation of a project outline that allows one to allocate tasks.You can customize a project’s tasks list view to include the columns you need to meet your information requirements. The columns of the ConceptDraw PROJECT Gantt view contain the information you want to capture about each task in your project. The following article details what information can be contained in the columns of a project outline:<
Work Order Process Flowchart. Business Process Mapping Examples
The business process is a set of actions or tasks which are undertaken by an organization for production some goods or services, they are then offered for the customers and are ordered by them. Process Flowcharts and Order Process Flowcharts are sufficiently prevalent, well known and actively used in variety of fields of life, business and science. They are constructed using the common standardized symbols, thus are clear and understandable for all. They help effectively represent the processes, determine the order in which the process activities happen, document the order processes, and also effectively analyze the processes with a goal to increase their efficiency. Create your own Process Flowcharts, Order Process Flowcharts, Cross-Functional Flow Charts representing the order processing steps using powerful drawing tools of ConceptDraw PRO software and variety of predesigned vector objects from the libraries of Business Process Mapping Solution from Business Processes area of ConceptDraw Solution Park.HelpDesk
What Information can be Displayed in the Multiproject Dashboard View
What information can can contain the projects list
Process Flowchart
The main reason of using Process Flowchart or PFD is to show relations between major parts of the system. Process Flowcharts are used in process engineering and chemical industry where there is a requirement of depicting relationships between major components only and not include minor parts. Process Flowcharts for single unit or multiple units differ in their structure and implementation. ConceptDraw PRO is Professional business process mapping software for making Process flowcharts, Process flow diagram, Workflow diagram, flowcharts and technical illustrations for business documents and also comprehensive visio for mac application. Easier define and document basic work and data flows, financial, production and quality management processes to increase efficiency of your business with ConcepDraw PRO. Business process mapping software with Flowchart Maker ConceptDraw PRO includes extensive drawing tools, rich examples and templates, process flowchart symbols and shape libraries, smart connectors that allow you create the flowcharts of complex processes, process flow diagrams, procedures and information exchange. Process Flowchart Solution is project management workflow tools which is part ConceptDraw Project marketing project management software. Drawing charts, diagrams, and network layouts has long been the monopoly of Microsoft Visio, making Mac users to struggle when needing such visio alternative like visio for mac, it requires only to view features, make a minor edit to, or print a diagram or chart. Thankfully to MS Visio alternative like ConceptDraw PRO software, this is cross-platform charting and business process management tool, now visio alternative for making sort of visio diagram is not a problem anymore however many people still name it business process visio tools.
 PM Planning
The PM Planning solution extends the functional abilities of ConceptDraw MINDMAP and ConceptDraw PROJECT software, allowing to automatically create the spreadsheets reflecting the tasks and project statuses for people who have different project roles. The reporting capabilities of this solution are represented by the possibility to generate a wide range of project reports that allow the project managers, senior management and other project participants to be informed on a project daily progress and monthly objectives: All Inclusive Report, All Visible Columns, Milestones with Notes and Objectives, Projects Goals, Projects Managers, Project Team, and Top Level Tasks. The PM Planning solution from ConceptDraw Solution Park is a strong project management and productivity tool which simplifies the process of reporting and lets one create a document with the desired report, includes the predesigned examples, extends and improves the planning capabilities for all team members, improves the project communication, helps to accurately plan, maintain, and finish projects on time, to track the work of project resources, to perform the analytical work and to make effective decisions.
 PM Dashboards
The PM Dashboards solution extends the management boundaries of ConceptDraw PRO and ConceptDraw PROJECT products with an ability to demonstrate changes to the budget status, to show the project progress toward its objectives, to display clearly the identified key performance indicator (KPI) or the set of key performance indicators for any project. This solution provides you with examples and ability to generate three types of visual dashboards reports based on your project data Project Dashboard, Tactical Dashboard, and Radar Chart. By dynamically charting the project’s key performance indicators that are collected on one ConceptDraw PRO document page, all project participants, project managers, team members, team leaders, stakeholders, and the entire organizations, for which this solution is intended, have access to the daily status of projects they are involved in.
What is Interactive Flowcharts
Organizing and Selecting Social Media Response Messages. Interactive Flowcharts can change the way one creates and organizes their social media response process.
 Bubble Diagrams
Bubble diagrams have enjoyed great success in software engineering, architecture, economics, medicine, landscape design, scientific and educational process, for ideas organization during brainstorming, for making business illustrations, presentations, planning, design, and strategy development. They are popular because of their simplicity and their powerful visual communication attributes.
 Business Processes Area
Solutions of Business Processes area extend ConceptDraw PRO software with samples, templates and vector stencils libraries for drawing business process diagrams and flowcharts for business process management.
 Management
This solution extends ConceptDraw PRO v9 and ConceptDraw MINDMAP v7 with Management Diagrams and Mind Maps (decision making, scheduling, thinking ideas, problem solving, business planning, company organizing, SWOT analysis, preparing and holding meetings
- Marketing Diagrams | Flowchart Marketing Process. Flowchart ...
- Mind Maps for Business - SWOT Analysis | What is SWOT Analysis ...
- Marketing Mind Maps | Mind Maps for Business - SWOT Analysis ...
- Mac Tools - SWOT Analysis | SWOT Analysis Solution - Strategy ...
- Mind Maps for Business - SWOT Analysis | Evernote + MindMapping ...
- Evernote + MindMapping | Using Evernote with a Mind Map | The ...
- Ppt On Online Brainstorming
- How to Use the ″ Online Store PR Campaign″ Sample | Online ...
- Take Notes Exchanging Mind Maps with Evernote | Build Strategies ...
- Marketing Launch Schedule Sample
- Creating a default presentation in ConceptDraw MINDMAP | How To ...
- How to Export a Mind Map into MS Word Document | How to Share ...
- Brainstorm Exchanging Mind Maps with Evernote | The Secret ...
- Marketing | Internet marketing - Concept map | Design elements ...
- Marketing | SWOT Analysis Solution - Strategy Tools | Sales Process ...
- Mind Mapping - Evernote
- How to do presentation of Mind Maps via Skype conference call ...
- Evernote Exchange | The Best Productivity Software | Evernote ...
- How To Do A Mind Map In PowerPoint | How To Do A PowerPoint In ...
- The Mind Map Evernote Possibilities | Evernote + MindMapping ...


