Bubble diagrams in Landscape Design with ConceptDraw DIAGRAM
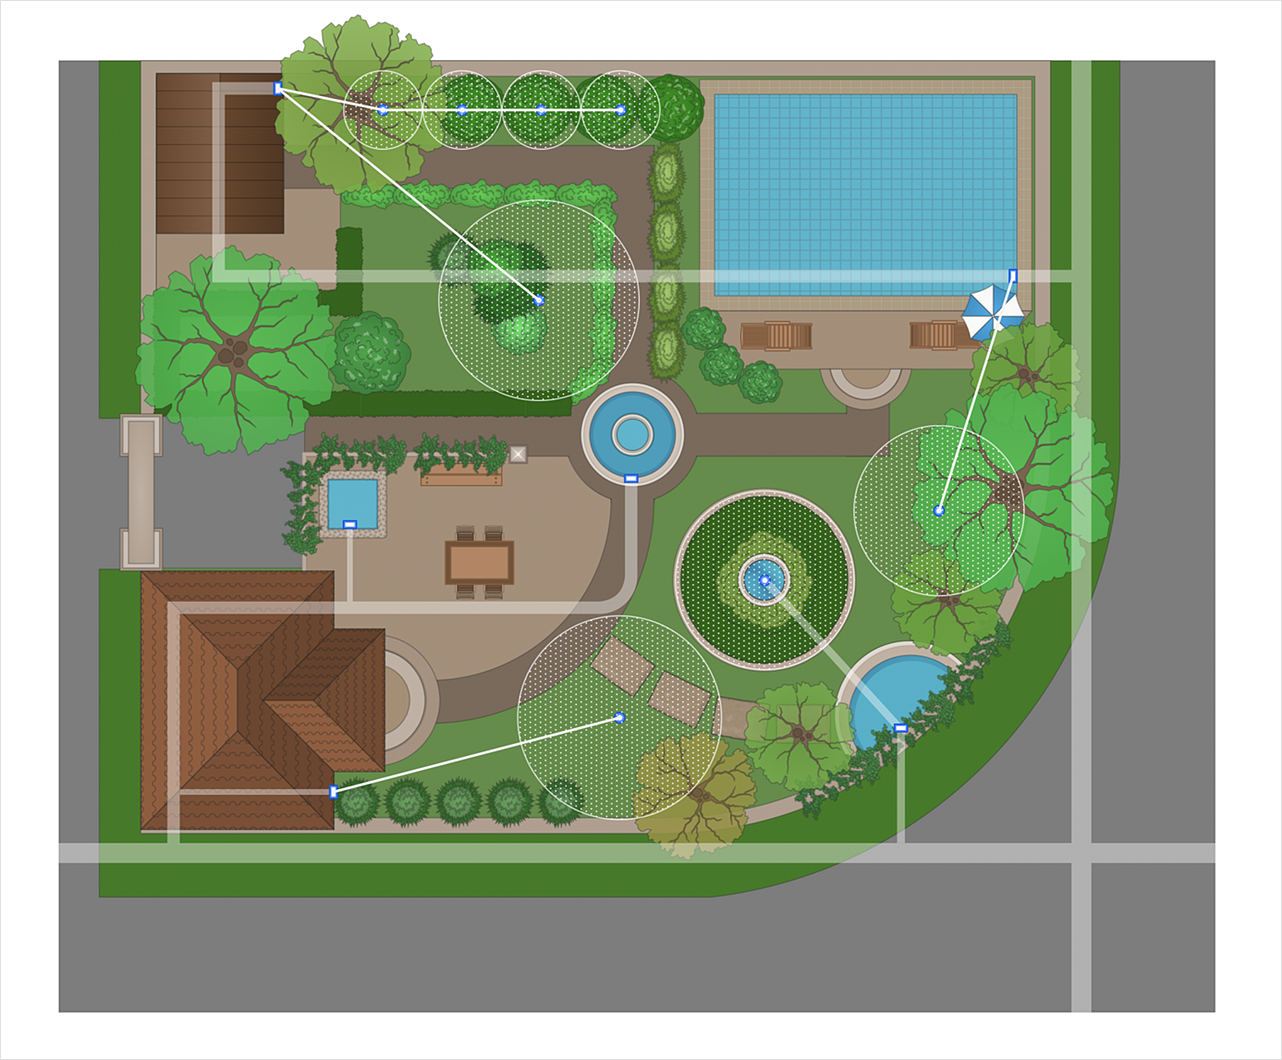
Bubble Diagrams are the charts with a bubble presentation of data with obligatory consideration of bubble's sizes. They are analogs of Mind Maps and find their application at many fields, and even in landscape design. At this case the bubbles are applied to illustrate the arrangement of different areas of future landscape design, such as lawns, flowerbeds, playgrounds, pools, recreation areas, etc. Bubble Diagram helps to see instantly the whole project, it is easy for design and quite informative, in most cases it reflects all needed information. Often Bubble Diagram is used as a draft for the future landscape project, on the first stage of its design, and in case of approval of chosen design concept is created advanced detailed landscape plan with specification of plants and used materials. Creation of Bubble Diagrams for landscape in ConceptDraw DIAGRAM software is an easy task thanks to the Bubble Diagrams solution from "Diagrams" area. You can use the ready scanned location plan as the base or create it easy using the special ConceptDraw libraries and templates.HelpDesk
How to Make a Garden Design
Landscape and garden design involves a varied range of activities that can be managed using ConceptDraw Landscape and Garden solution. Landscape and garden design can embrace landscape management, engineering, detailing, urbanism, assessment, and planning. The Landscape and Garden solution delivers the ability to sculpt your perfect garden design with a range of libraries and templates. These libraries include graphic design elements such as bushes and trees, flower and grass, ponds and fountains, garden furniture and accessories, and paths, plots, and patios. Using them in combination with the handy templates included with the solution is the quickest and simplest method of starting to plan your garden design.
 Plant Layout Plans
Plant Layout Plans solution can be used for power plant design and plant layout design, for making the needed building plant plans and plant layouts looking professionally good. Having the newest plant layout software, the plant design solutions and in particular the ConceptDraw’s Plant Layout Plans solution, including the pre-made templates, examples of the plant layout plans, and the stencil libraries with the design elements, the architects, electricians, interior designers, builders, telecommunications managers, plant design engineers, and other technicians can use them to create the professionally looking drawings within only a few minutes.
 Landscape & Garden
The Landscape and Gardens solution for ConceptDraw DIAGRAM is the ideal drawing tool when creating landscape plans. Any gardener wondering how to design a garden can find the most effective way with Landscape and Gardens solution.
 macOS User Interface
macOS User Interface solution extends the ConceptDraw DIAGRAM functionality with powerful GUI software graphic design features and tools. It provides an extensive range of multifarious macOS Sierra user interface design examples, samples and templates, and wide variety of libraries, containing a lot of pre-designed vector objects of Mac Apps icons, buttons, dialogs, menu bars, indicators, pointers, controls, toolbars, menus, and other elements for fast and simple designing high standard user interfaces of any complexity for new macOS Sierra.
HelpDesk
How to Draw a Scatter Diagram
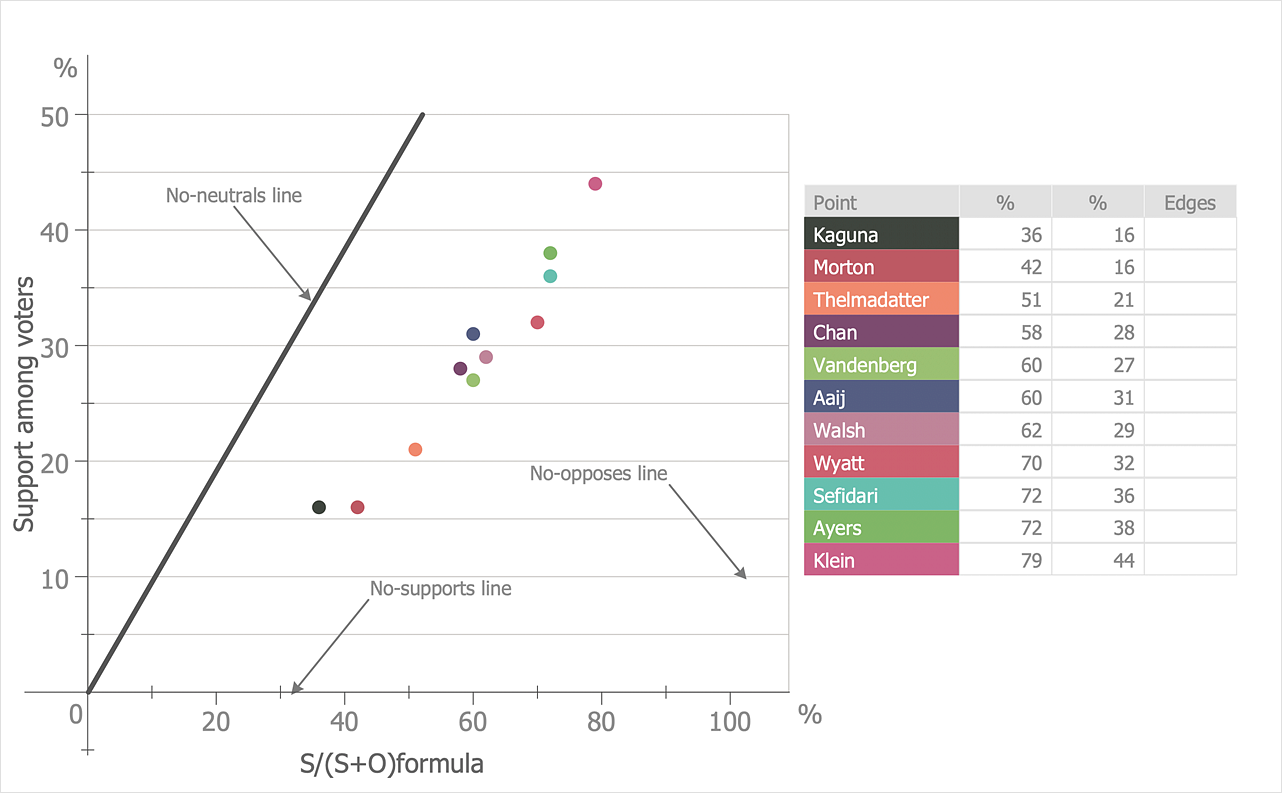
Scatter Diagrams are used to visualize how a change in one variable affects another. A Scatter Diagram displays the data as a set of points in a coordinate system. It combines these values into single data points and displays them in uneven intervals. A Scatter Diagram can be very useful for identifying relationships between variables, for example, the relationship between price and quality rating. Making a Scatter Diagram involves many different elements that can be managed using ConceptDraw Scatter Diagram solution.
 Seating Plans
The Seating Plans solution including samples, seating chart templates and libraries of vector design elements assists in creating the Seating plans, Seating arrangement charts, Chair layout designs, Plan drawings of cinema seating, Movie theater chair plans, extensive Cinema theater plans depicting the seating arrangement in the cinema halls, location of closet, cafe and food sale area, in designing the Seating plans for the large seating areas, Seat plan designs for airplanes, trains, etc. Use any of the included samples as the table seating chart template or seating chart template free and achieve professional drawing results in a few minutes.
 Seven Basic Tools of Quality
Manage quality control in the workplace, using fishbone diagrams, flowcharts, Pareto charts and histograms, provided by the Seven Basic Tools of Quality solution.
- Scatter Plot | Blank Scatter Plot | Design elements - Scatterplot ...
- Design A Flowchart Online
- Online Printable Calendar 2016
- Design elements - Marketing charts | How to Create a Picture Graph ...
- Online Software Draw Block Diagrams
- Scatter Plots
- Design elements - Correlation charts | Line Chart Examples | Scatter ...
- Design Flowchart Online
- Online Restraunt Design
- Design elements - Electrical and telecom
- Design Workflow Online
- Bubble Diagrams | Bubble diagrams in Landscape Design with ...
- Scatter Graph | Scatter graphs - Vector stencils library | Design ...
- Online Workflow Designer
- Workflow Designer Online
- Example of DFD for Online Store (Data Flow Diagram) DFD ...
- Design elements - Comparison charts and indicators | Design ...
- Bubble diagrams in Landscape Design with ConceptDraw PRO ...
- Bubble Chart Maker | How to Draw a Bubble Chart | Bubble ...
- Scatter Plot Us Parks


