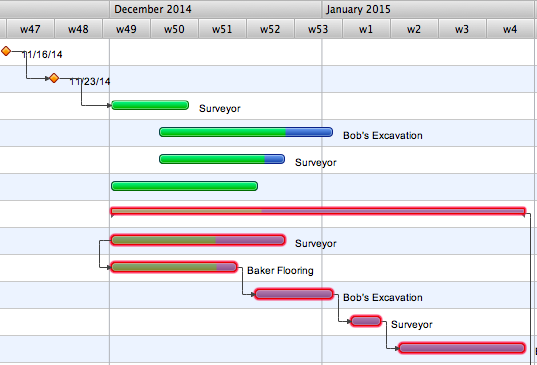
Project —Task Trees and Dependencies
Users new to ConceptDraw PROJECT will find the Basic lessons an essential platform for familiarizing themselves with the program′s functions. This video lesson will teach you how to set up task trees and dependencies.HelpDesk
What Information to be Displayed in the ConceptDraw PROJECT Gantt Chart View
What information can can contain the project task list? Gantt Chart view is a graphical representation of a project outline that allows one to allocate tasks.You can customize a project’s tasks list view to include the columns you need to meet your information requirements. The columns of the ConceptDraw PROJECT Gantt view contain the information you want to capture about each task in your project. The following article details what information can be contained in the columns of a project outline:<
HelpDesk
How to Create a Custom Filter in ConceptDraw PROJECT for Windows
With ConceptDraw Project, you can filter project data so that you only see the information that’s most important to you.HelpDesk
How to Use Critical Path Analysis for Scheduling Complex Projects
Instruction on how to use this important project management tool with ConceptDraw PROJECTHelpDesk
How to Create a Timeline Diagram in ConceptDraw PRO
A Timeline is a chart which displays a project plan schedule in chronological order. A Timeline is used in project management to depict project milestones and visualize project phases, and show project progress. The graphic form of a timeline makes it easy to understand critical project milestones, such as the progress of a project schedule. Timelines are particularly useful for project scheduling or project management when accompanied with a Gantt chart. It captures the main of what the project will accomplish and how it will be done. making a project timeline is one of the most important skills a project manager needs have. Making comprehensive, accurate timelines allows you getting every project off in the best way. ConceptDraw PRO allows you to draw a timeline charts using special library.
 ConceptDraw Solution Park
ConceptDraw Solution Park collects graphic extensions, examples and learning materials
 ConceptDraw Solution Park
ConceptDraw Solution Park collects graphic extensions, examples and learning materials
HelpDesk
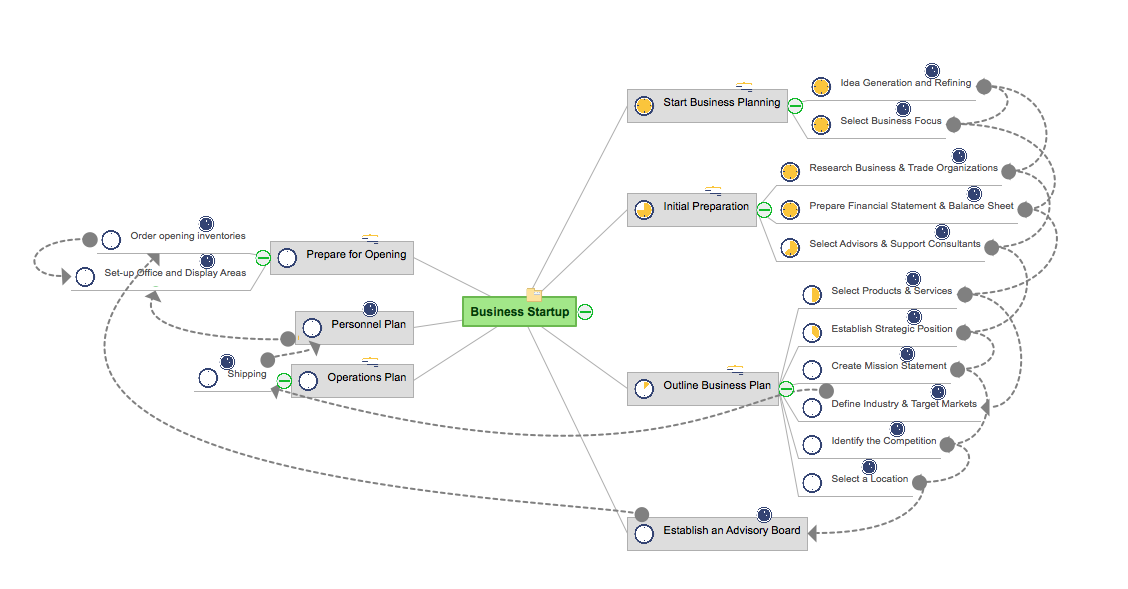
How to Make a Mind Map from a Project Gantt Chart
ConceptDraw Office allows you to see the project data from ConceptDraw PROJECT in a mind map structure by opening your project in ConceptDraw MINDMAP.- Pert Chart For Online Shopping Project
- How To Drow A Sequence Diagrame For Online Shopping Project
- How to Use Critical Path Analysis for Scheduling Complex Projects ...
- Conceptdraw.com: Mind Map Software, Drawing Tools | Project ...
- Solve Online Critical Path Of The Project Duration
- How To Create a PERT Chart | Example of DFD for Online Store ...
- Information About Online Shopping Project
- Flow Chart Online | How to Create a Timeline Diagram in ...
- Pert Chart For Online Shopping Project Download
- Flow Chart Online | Online Flow Chart | How to Create a Timeline ...
- Flow Chart Online | How To Create a PERT Chart | How to Create a ...
- Pert Chart Creator Online
- State Diagram Example - Online Store
- Free Online Chart
- How to Use Critical Path Analysis for Scheduling Complex Projects ...
- Critical Path Method Example With Solution Online Chart
- Mind Map Exchange | How to Deliver Presentations using Mind ...
- Top 5 Android Flow Chart Apps | Flow Chart Online | Create Flow ...
- Free Online Charts
- How to Collaborate in Business via Skype | Online Collaboration via ...


