Cross-Functional Flowchart
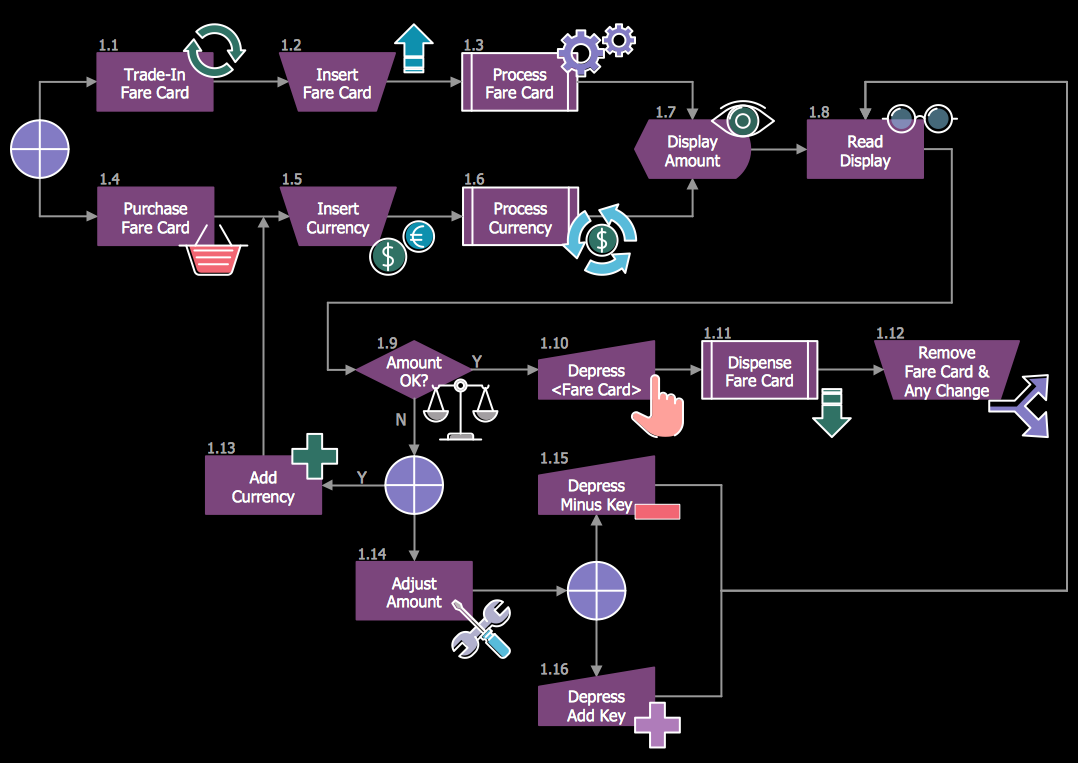
Use of Cross-Functional Flowchart is a clear way of showing each team member’s responsibilities and how processes get shared or transferred between different responsible people, teams and departments. Use the best flowchart maker ConceptDraw PRO with a range of standardized cross-functional flowchart symbols to create the Cross-Functional Flowcharts simply and to visualize the relationship between a business process and the functional units responsible for that process. To draw the most quickly Cross-Functional Flowcharts, Cross Functional Process Maps, or Cross Functional Process Flow Diagrams, start with a Cross-functional flowchart samples and templates from ConceptDraw Solution Park. The ConceptDraw Arrows10 and RapidDraw technologies will be also useful for you in drawing. ConceptDraw PRO supports designing both types - horizontal and vertical Cross-functional flowcharts. A vertical layout makes the accents mainly on the functional units while a horizontal layout - on the process. If you need a Visio alternative in Mac OS X, try ConceptDraw PRO. Its interface is very intuitive and it’s actually much easier to use than Visio, yet somehow it’s just as powerful if not more so. ConceptDraw PRO performs professional quality work and seamless Visio interaction.
HelpDesk
How to Draw a Decision-Making Diagram
The Decision-Making solution provides ConceptDraw PRO users with vector libraries, containing a full set of flowchart symbols. Also, it offers a number of templates and samples, making short work of creating a graphical view of decision-making processes.Decision Making
Decision Making - ConceptDraw Office suite provides visual tools that are given support on the stage of the decision making. The Seven Management and Planning Tools is a set for such diagrams: Affinity Diagram, Relations Diagram, Prioritization Matrix, Root Cause Tree Diagram, Involvement Matrix, PERT Chart, Risk Diagram (PDPC).
Basic Flowchart Symbols and Meaning
Flowcharts are the best for visually representation the business processes and the flow of a custom-order process through various departments within an organization. ConceptDraw PRO diagramming and vector drawing software extended with Flowcharts solution offers the full set of predesigned basic flowchart symbols which are gathered at two libraries: Flowchart and Flowcharts Rapid Draw. Among them are: process, terminator, decision, data, document, display, manual loop, and many other specific symbols. The meaning for each symbol offered by ConceptDraw gives the presentation about their proposed use in professional Flowcharts for business and technical processes, software algorithms, well-developed structures of web sites, Workflow diagrams, Process flow diagram and correlation in developing on-line instructional projects or business process system. Use of ready flow chart symbols in diagrams is incredibly useful - you need simply drag desired from the libraries to your document and arrange them in required order. There are a few serious alternatives to Visio for Mac, one of them is ConceptDraw PRO. It is one of the main contender with the most similar features and capabilities.
Cause and Effect Analysis
Cause and Effect Analysis - The Seven Management and Planning Tools is a tool for Cause and Effect Analysis that allows users to analyze the root causes for factors that influenced the problem. This diagram is constructed separately for each highly prioritized factor. The Diagram is then used for further formulation of potential actions.
How to Design Landscape
How to design landscape? You can draw it by hand on a sheet of paper, but for this you need to know the bases of the perspective, you need to have good artistic abilities and to know how to depict the natural elements. But it is much easier and convenient to use the modern ConceptDraw PRO diagramming and vector drawing software extended with Landscape & Garden Solution from the Building Plans Area.Pyramid Diagram
Pyramid diagram is a chart used to visualize the data in a hierarchical (pyramid-like) structure and depict the foundation-based relationships. Pyramid diagram looks like a triangle divided by lines into several sections (layers) and can be oriented up or down, and represented in 2D or 3D view. 2D Pyramid diagrams are a great way to illustrate the hierarchical structure, 3D Pyramids are equally good to represent the class stratification and hierarchy. ConceptDraw PRO diagramming and vector drawing software with included Pyramid Diagrams solution from Marketing area of ConceptDraw Solution Park is a powerful application which contains templates and library of vector design elements for instantly drawing three level Pyramid model, four level and five level Triangle charts. All predesigned objects are easy for changing color style and resizing according to your needs, and ConceptDraw documents with Pyramid diagrams can be easy exported in various formats for further using in marketing presentations, for effective analyzing hierarchy levels and illustration your data and ideas.Influence Diagram Software
Influence diagram (ID) is a graphical and mathematical representation of the decision. Influence diagrams are widely used in the decision analysis and in the game theory. They are the alternative to the decision tree. The influence diagram gives to analyst the high-level conceptual view that it can use to build the detailed quantitative model. This sample shows the Influence diagram. It is a directed acyclic graph with three types of nodes: Decision node is drawn as a rectangle, Uncertainty node is drawn as an oval, Value node is drawn as an octagon. The nodes are connected with arcs.Stakeholder Mapping Tool
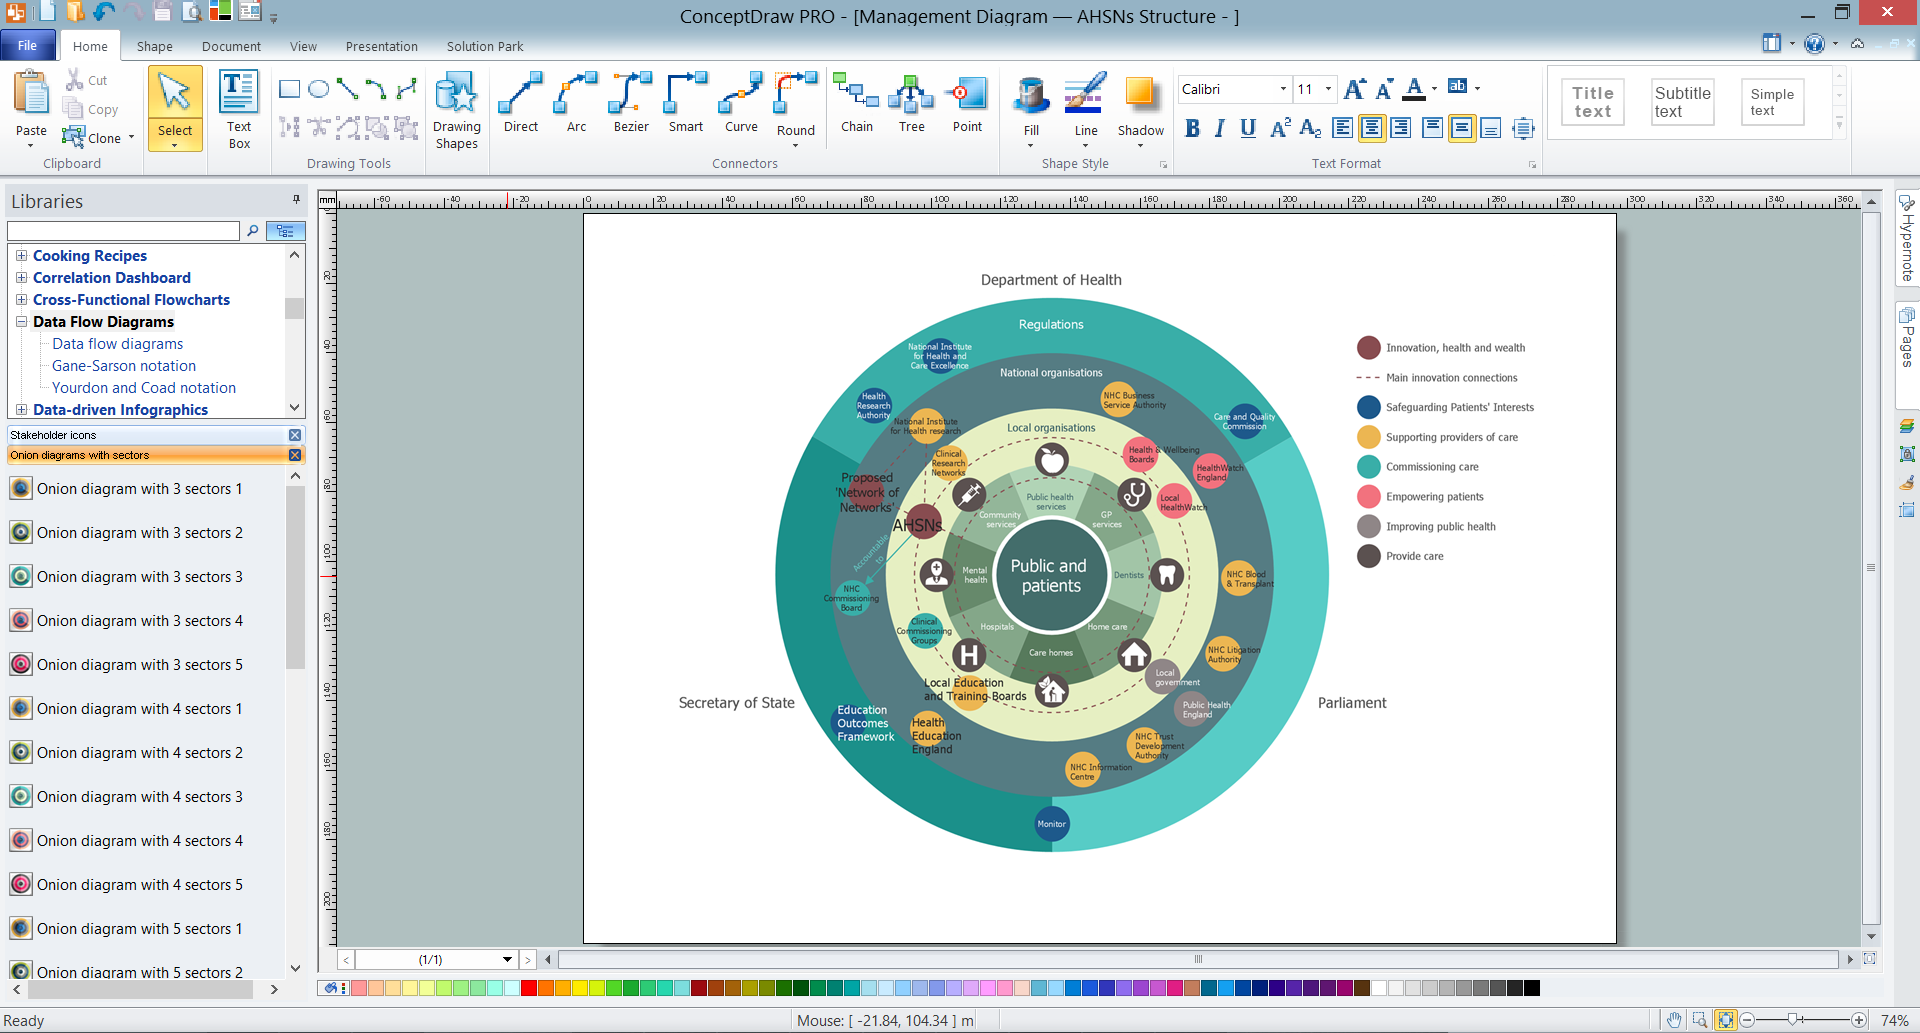
Stakeholders are the groups of people or organizations whose contribution matters to the organization's success, this can be labour participation, financial participation, dissemination of information about organization, etc. So, the employees of the company, its suppliers, customers, media, public organizations, state authorities, all they are stakeholders of the company. ConceptDraw PRO diagramming and vector drawing software extended with Stakeholder Onion Diagrams Solution from the Management Area of ConceptDraw Solution Park is a powerful stakeholder mapping tool which allows easy create Stakeholder Onion diagrams and maps depicting the layers of a project, relationships of stakeholders to a project goal, and relationships between stakeholders.- Decision Tree Diagram Generator Online
- Decision Tree Builder Online
- ConceptDraw PRO Compatibility with MS Visio | Online Decision Tree
- Decision Tree Maker Online Free
- Online Decision Tree Creator
- Make Decision Tree Online
- Free Online Decision Tree Maker
- Fishbone Diagram Vs Decision Tree
- Draw Decision Tree Online


