HelpDesk
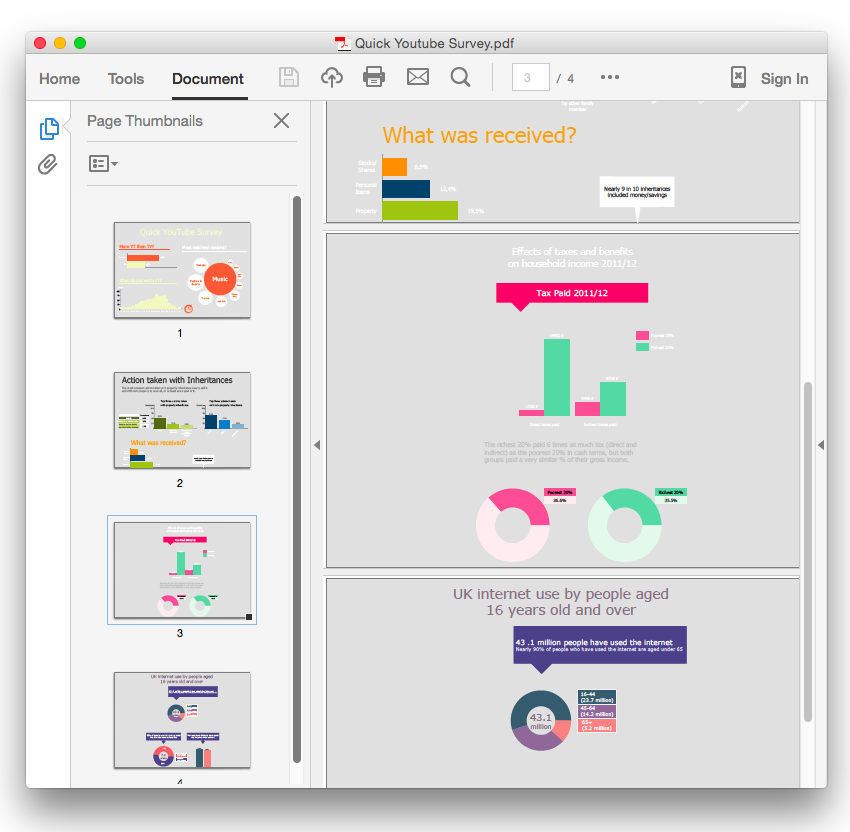
How To Convert Data-driven Infographics to Adobe PDF Using ConceptDraw PRO
ConceptDraw PRO allows you to easy share your business documentation between different computers with different operating systems and applications using it's export capabilities.You can get clear infographics in pdf format and avoid any problems while communicating it with stakeholders.HelpDesk
How to Connect a Live Object to a Text Data Source
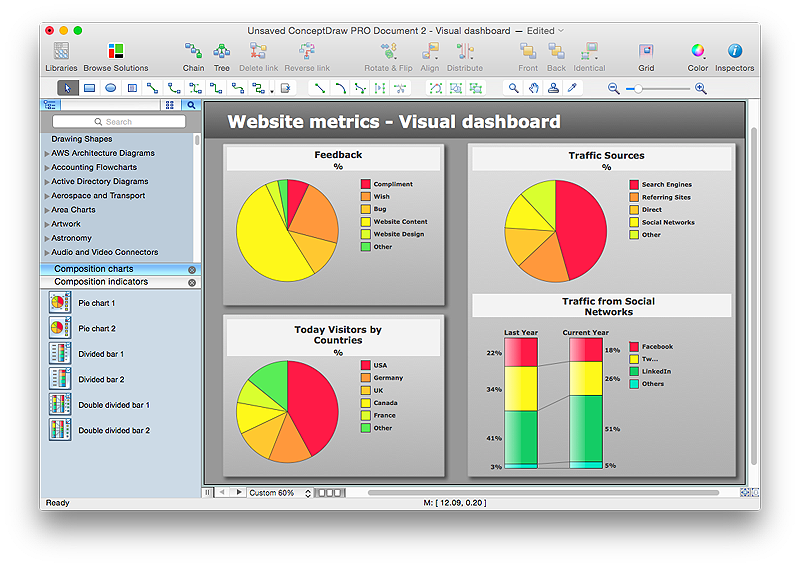
Instruction on how to connect a ConceptDraw live object with data source files in TXT format to visualize the actual values of your performance metrics.
HelpDesk
How to Connect Tabular Data (CSV) to a Graphic Indicator on Your Live Dashboard
The Time Series Dashboard Solution can be used to create the interactive Time Series Charts as Column Charts, Line Charts, or Bar Charts for your interactive dashboard.HelpDesk
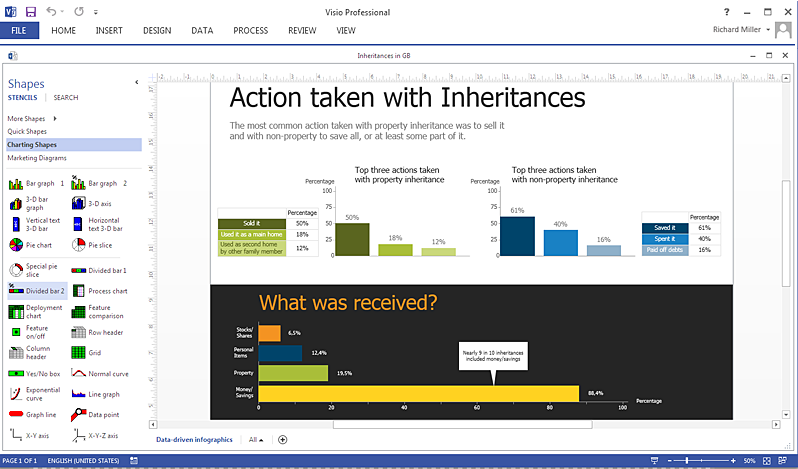
How To Create a MS Visio Data-driven Infographics Using ConceptDraw PRO
ConceptDraw PRO allows you to easily create data-driven infographics of any complexity and then make a MS Visio file from your diagram in a few simple steps.HelpDesk
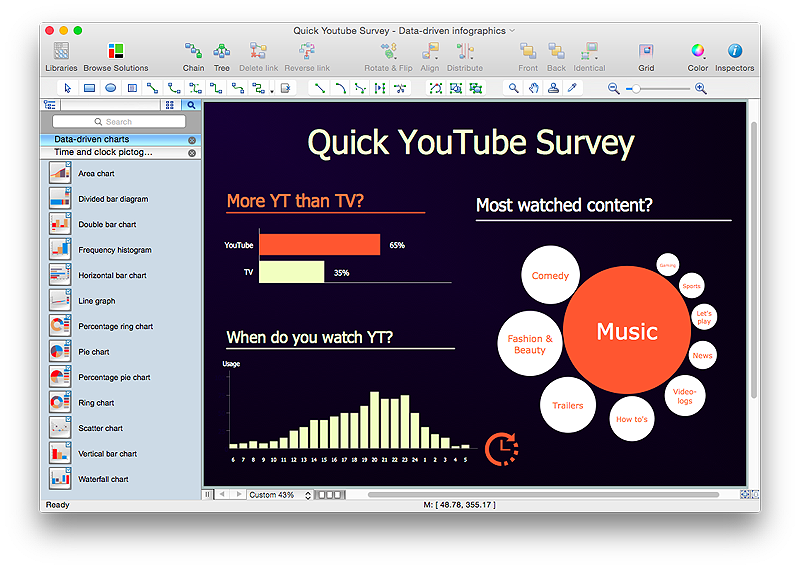
How to Create Data-driven Infographics
Data-driven infographics are used in wildly disparate areas of business and commerce. To make effective Data-driven infographics, it's useful to have a wide variety of graphical elements — icons, clipart, stencils, charts and graphs — to illustrate your diagram. ConceptDraw Data-driven Infographics solution provides all the tools you need to present data as described by this article — as well as the charts mentioned previously, you can find histograms, divided bar charts, ring charts, line graphs and area charts — meaning you can find the perfect medium for displaying a certain type of data. It allows you to draw data driven infographics quickly and easily using the special templates and vector stencils libraries.It can be used to quickly communicate a message, to simplify the presentation of large amounts of data, to see data patterns and relationships, and to monitor changes in variables over time.HelpDesk
How to Input Data from MS Excel Into a Mind Map
Many people apply Excel documents to store data in the form of hierarchical lists. With ConceptDraw MINDMAP you can easily turn the linear structure of an Excel table in a radial structure of mind map ConceptDraw MINDMAP will create a mind map file (CDMZ) from your Excel (XLS) file. If you keep your information in the Microsoft Excel files, you can import them into ConceptDraw MINDMAP, converting the columns and rows to a hierarchical structured mind map. If you have multiple individual sheets in your Excel workbook, ConceptDraw MINDMAP will turn them into a single multi-page mind map. ConceptDraw MINDMAP lets you import an entire Microsoft® Excel file as well as insert data from the selected cells.HelpDesk
How to Create PowerPoint Presentation from Data Driven Infographics Using ConceptDraw PRO
ConceptDraw PRO can be used as a tool for creating data-driven infographics. It allows you to draw data driven using the special templates and vector stencils libraries. ConceptDraw PRO allows you to make a MS PowerPoint Presentation from your Data-driven infographics in a few simple steps.HelpDesk
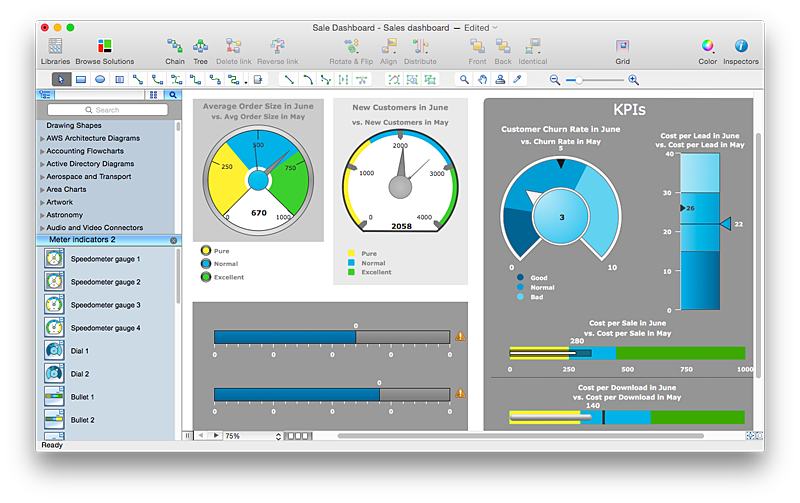
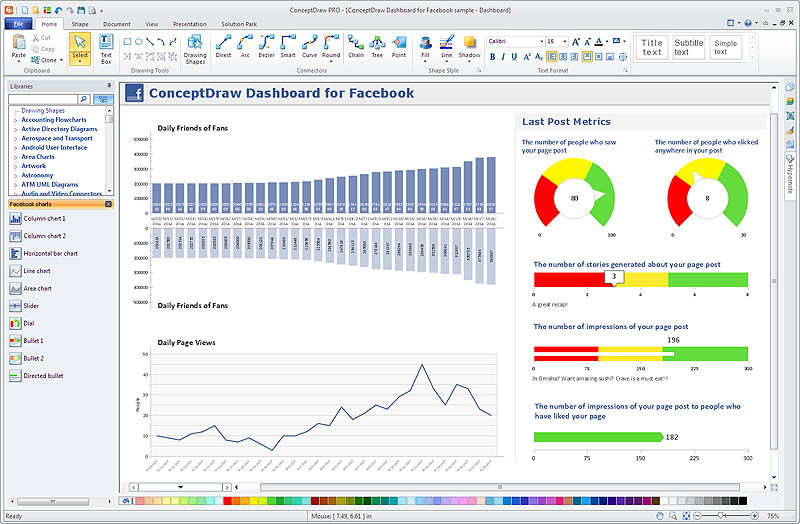
How to Use ConceptDraw Dashboard for Facebook on PC
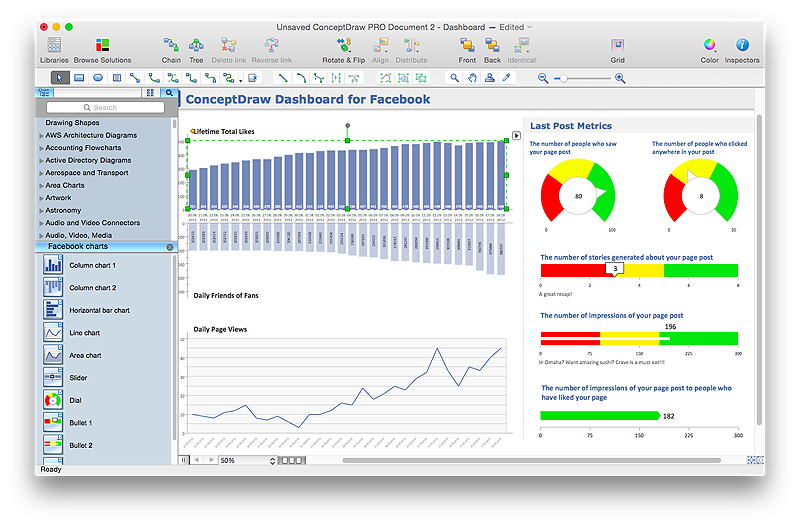
The ConceptDraw Dashboard for Facebook Solution is a visual dashboard that visualizes lifetime total Likes, daily Friends of Fans, and daily Page views based on the information exported from your Facebook Page.HelpDesk
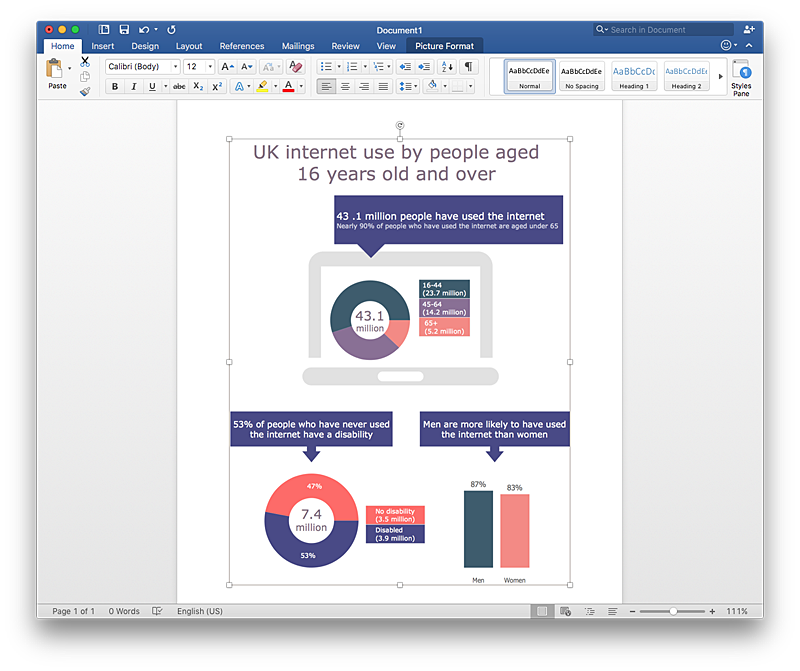
How to Add Data-driven Infographics to a MS Word Document Using ConceptDraw PRO
Infographics ae usually used as an effective way of showing a certain portion of information . There are a wide of range of subjects that can be represented in a such way. One of the most simple usage for the infographics, in business diagrams. Sales staff can use it as an effective method of sharing the sales results with the entire team and stakeholders. ConceptDraw Data-driven Infographics solution gives all the tools one need to present a certain type of data. ConceptDraw PRO allows you to easily create data-driven infographics and then insert them into a MS Word document.HelpDesk
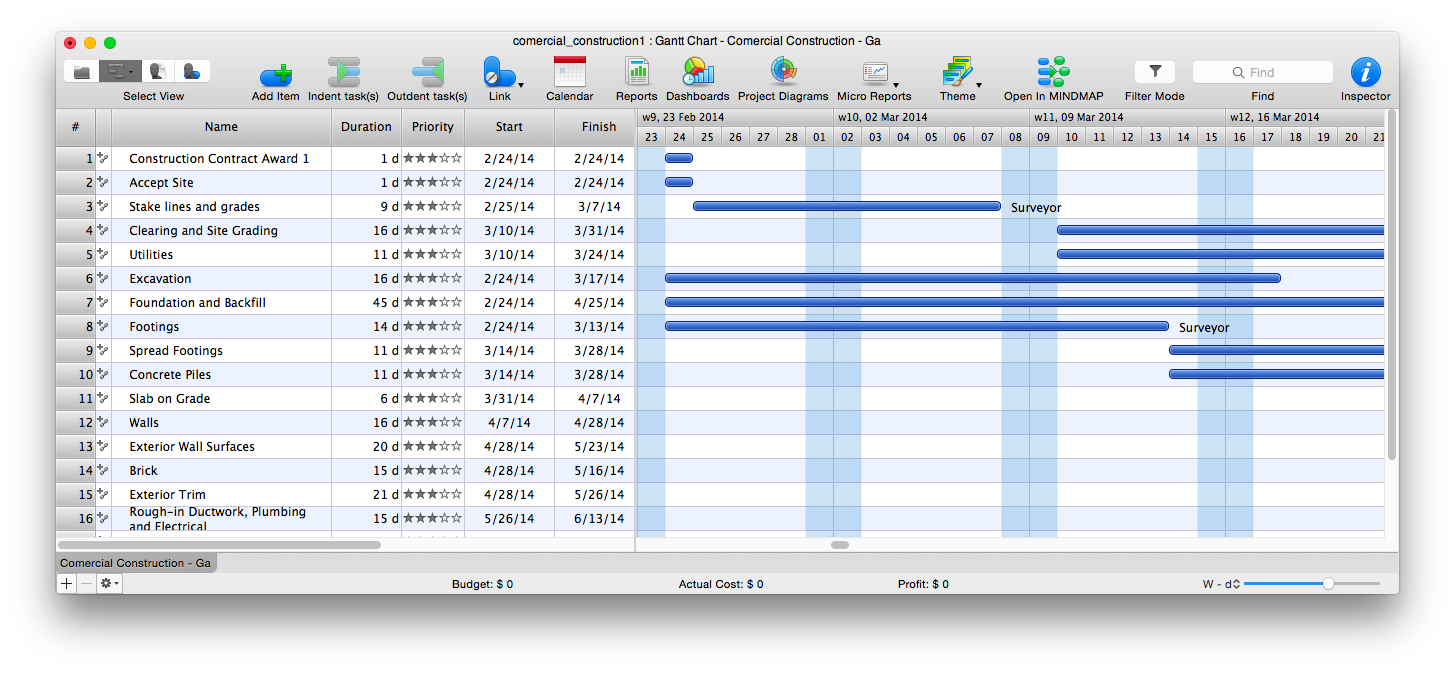
How to Import Project Data From MS Excel Worksheet
You can import information into the project from MS Excel workbook using the entered fields - fields in which you can enter or edit information as opposed to calculated fields.HelpDesk
How to Open Visio® VDX File Using ConceptDraw PRO
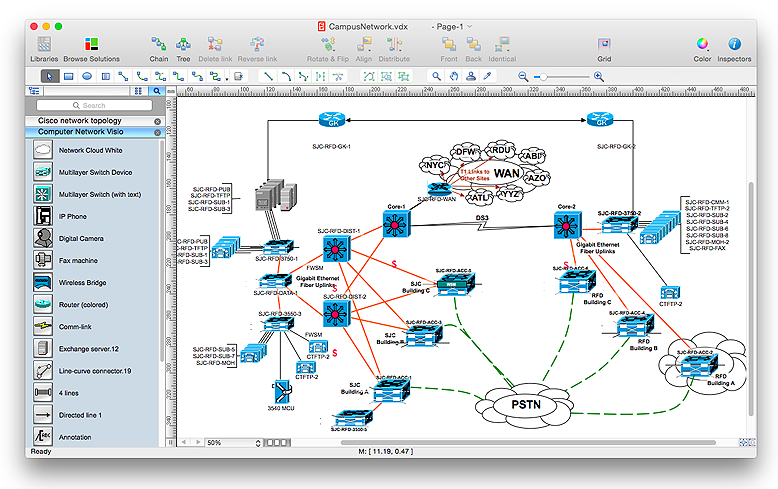
MS Visio file with the extention .VDX can be created with the MS Visio 2003-2007. It is a filename extension for the MS Visio XML drawing file format. MS Visio 2010 and earlier versions support reading and writing files in a binary VSD or xml-based VDX file formats. Since MS Visio 2013 drawing files are written in the new VSDX and VSDM file formats. The writing VDX files is no longer supported. If you used MS Visio 2003-2010 before and now is considering to switch to ConceptDraw PRO, maybe this is a good news - ConceptDraw PRO v10 is still supported reading and writing of Microsoft Visio XML file format. Thus replacing the diagramming software , allows to keep all your drawings, created in the old versions of MS Visio. Making business drawings with ConceptDraw PRO is easier than using MS Visio. Moreover, you will be able to use a huge number of business-oriented libraries supplied by ConceptDraw Solution Park. Also, using ConceptDraw you can create your custom objects and supplement libraries to cover your requirements.Visio Files and ConceptDraw
Visio Files and ConceptDraw. ConceptDraw PRO is compatible with MS Visio .VDX formatted files.VDX is Visio’s open XML file format, and it can be easily imported and exported by ConceptDraw PRO.HelpDesk
How to Use ConceptDraw Dashboard for Facebook on OS X
The ConceptDraw Dashboard for Facebook Solution is a visual dashboard that visualizes lifetime total Likes, daily Friends of Fans, and daily Page views based on the information exported from your Facebook Page.Internet solutions with ConceptDraw PRO
ConceptDraw is a good means of visualization of information of any kind as it features powerful graphic capabilities. The conception of using ConceptDraw and open formats by the programs that work with Internet can be used for displaying any data and any structure in Internet.HelpDesk
How to Connect Text Data to a Time Series Chart on Your Live Dashboard
Time Series Dashboard means an integration of some type of diagrams: Line Charts, Bar Charts, Column Charts, and Dot Plots on a single space. The ConceptDraw Time Series Dashboard solution can be used to create the interactive Time Series dashboard. The libraries of Time Series Charts solution contain the Live Objects, that can change their appearance depending on the external data. Each chart from the Time Series dashboard displays particular source data. You can include Time Series Charts in your business or technical dashboards to show and compare the items changing over time.
- Open Data Communities Maps
- Open Data Datasets
- Call center network diagram | Windows Azure | Chemistry Drawings ...
- Linking Open Data
- Open Data Link
- Open Data Sets
- Linking Open Data Cloud Diagram
- Linking Open Data Project
- Process Flowchart | Data Flow Diagrams (DFD) | Flowchart on Bank ...
- Open Source Visio 2016
- How To Import Shape Data from Visio to ConceptDraw PRO | How to ...
- Uml Open Source
- Block Diagram Software Open Source
- How to Create Cisco Network Diagram | EIGRP. Computer and ...
- Open Source Uml Modeling Tool
- New Bank Account Open Class Diagram
- UML class diagram - Bank account | ATM UML Diagrams | Data ...
- Open Source Php Workflow
- Create Organizational Chart | Process Flowchart | Orgchart | Open ...
