HelpDesk
How to Connect a Live Object to a Text Data Source
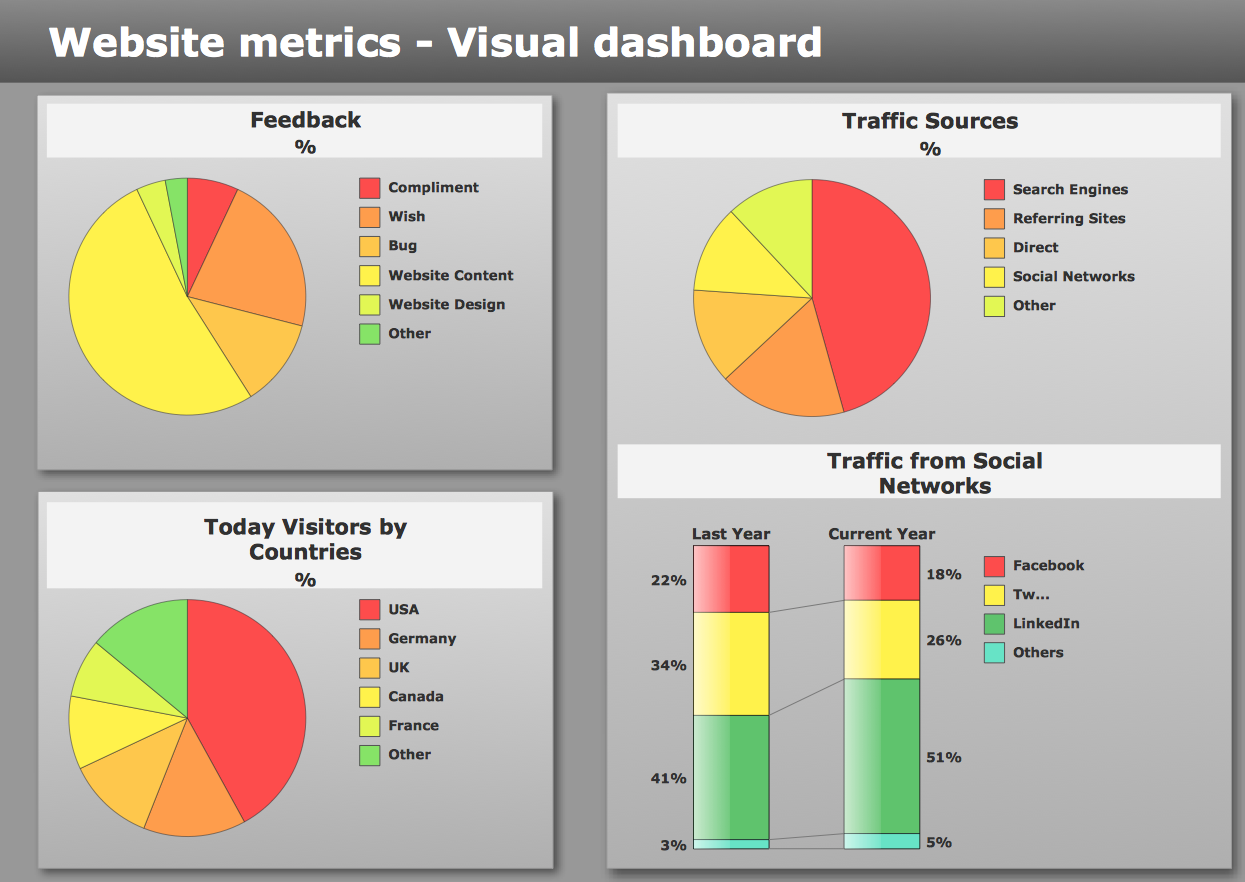
You can easily create a visual dashboard using charts and graphics indicators from Live Objects libraries. Here is an instruction on how to connect a ConceptDraw live object with data source files in TXT format to visualize the actual values of your performance metrics.HelpDesk
How to Create a Meter Dashboard
The Time Series Dashboard Solution can be used to create the interactive Time Series Charts as Column Charts, Line Charts, or Bar Charts for your interactive dashboard.ConceptDraw DIAGRAM Compatibility with MS Visio
The powerful diagramming and business graphics tools are now not exception, but the norm for today’s business, which develop in incredibly quick temp. But with the abundance of powerful business diagramming applications it is important to provide their compatibility for effective exchange the information between the colleagues and other people who maybe use different software in their work. During many years Microsoft Visio™ was standard file format for the business and now many people need the visual communication software tools that can read the Visio format files and also export to Visio format. The powerful diagramming and vector drawing software ConceptDraw DIAGRAM is ideal from the point of view of compatibility with MS Visio. Any ConceptDraw DIAGRAM user who have the colleagues that use MS Visio or any who migrates from Visio to ConceptDraw DIAGRAM , will not have any problems. The VSDX (Visio′s open XML file format) and VDX formatted files can be easily imported and exported by ConceptDraw DIAGRAM , you can see video about this possibility.HelpDesk
How to Use ConceptDraw Dashboard for Facebook on PC
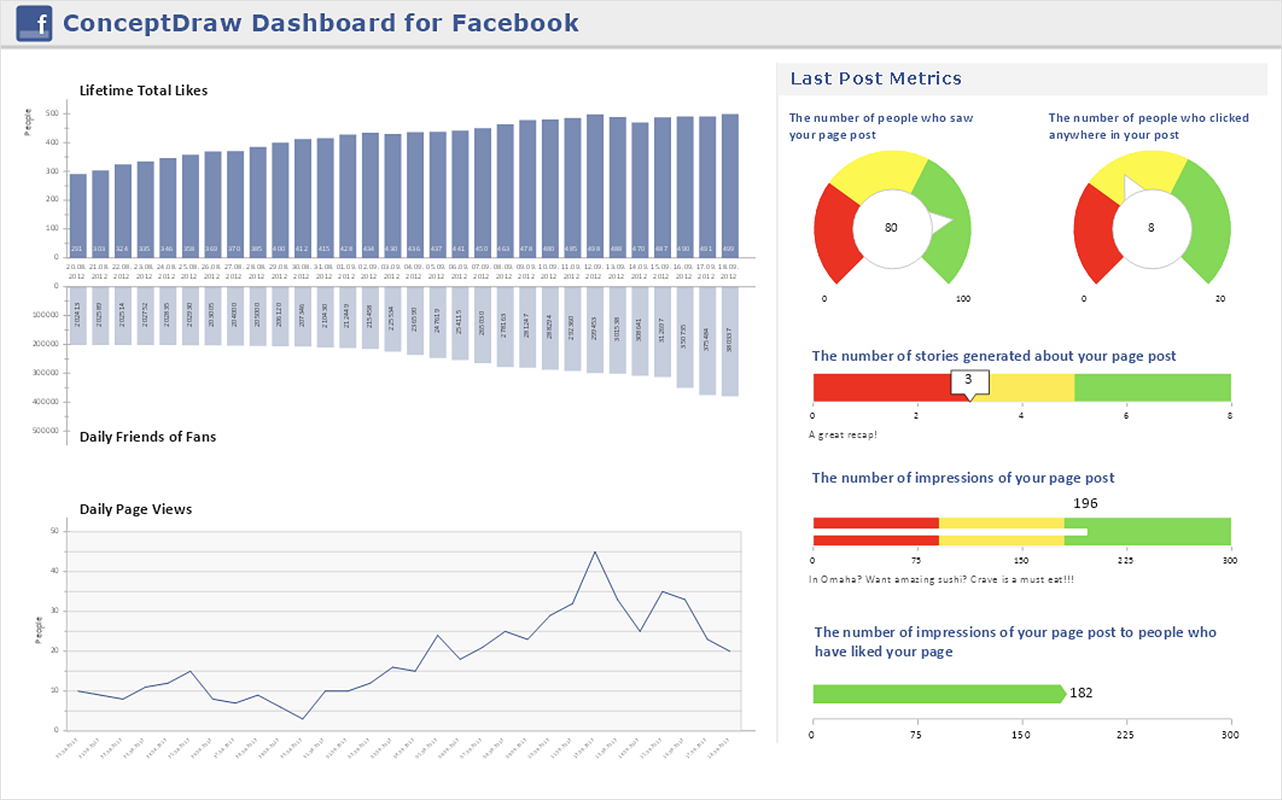
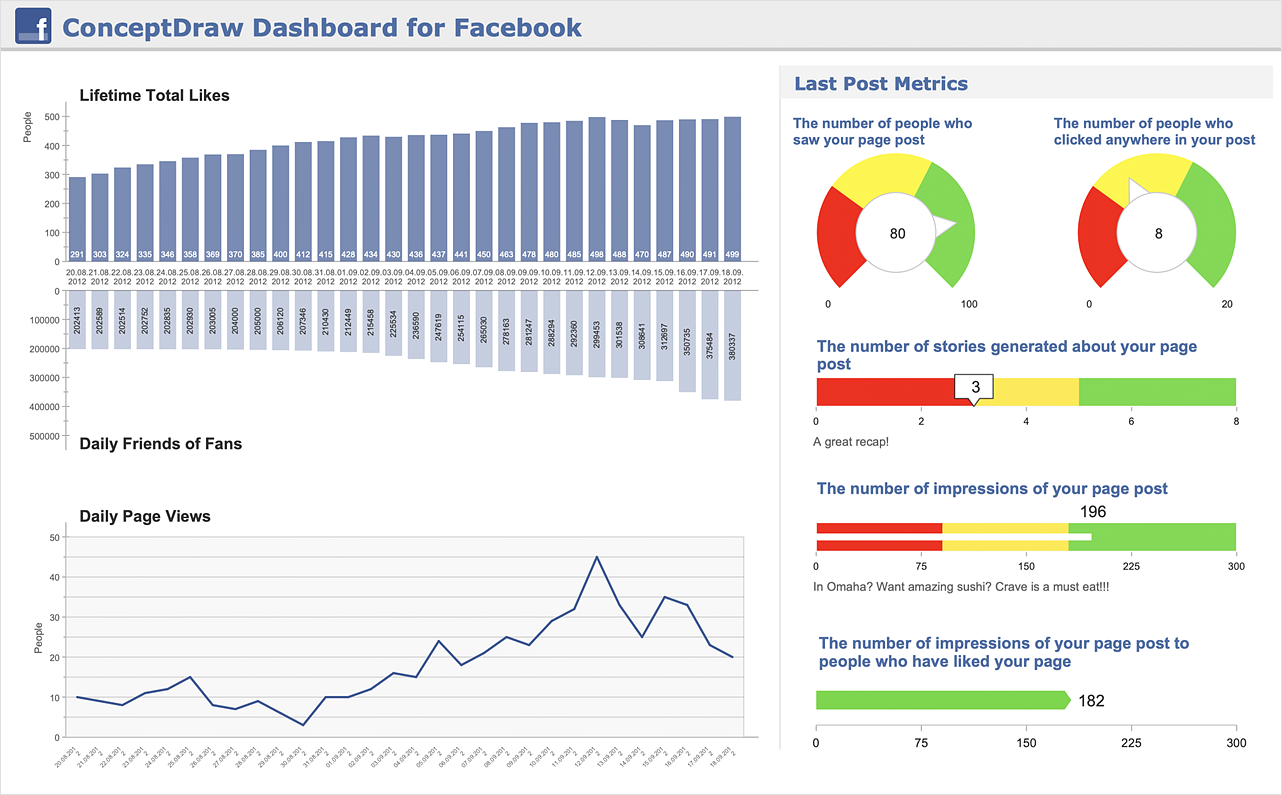
The ConceptDraw Dashboard for Facebook Solution is a visual dashboard that visualizes lifetime total Likes, daily Friends of Fans, and daily Page views based on the information exported from your Facebook Page.HelpDesk
How to Create a Time Series Dashboard
Time Series Dashboard means integration of some type of diagrams: Line Charts, Bar Charts, Column Charts, and Dot Plots on a single space. The ConceptDraw Time Series Dashboard solution can be used to create the interactive Time Series dashboard. The libraries of Time Series Charts solution contain the Live Objects, that can change their appearance depending on the external data. Each chart from the Time Series dashboard displays particular source data. You can include Time Series Charts in your business or technical dashboards to show and compare the items changing over time.HelpDesk
How to Use ConceptDraw Dashboard for Facebook on Mac
The ConceptDraw Dashboard for Facebook Solution is a visual dashboard that visualizes lifetime total Likes, daily Friends of Fans, and daily Page views based on the information exported from your Facebook Page.- Open Source Business Process Management
- Open Source Workflow Management System
- Best Open Source Software Swim Lanes
- Org Chart Software Open Source
- SysML Diagram | SysML | Process Flowchart | Open Source Uml ...
- Open Source Agile Project Management
- Er Diagram Open Source
- Technical Drawing Software Open Source
- Stakeholder Onion Diagrams | Office Layout Plans | Comparison ...
- Open Source Network Diagramming Tool
- Open Source Version Of Visio
- SysML Diagram | SysML | Process Flowchart | Open Source Uml ...
- Open Source Cloud Computing
- Workflow Management Systems
- Entity Relationship Diagram Open Source
- Office Workflow Management
- Open Source Visio Alternatives
- Open Source Visio Alternative Windows
- Basic Flowchart Symbols and Meaning | Process Flowchart | Swim ...
- Cross-Functional Flowchart | Business Process Flowchart Symbols ...


