Cross-Functional Process Map Template
When you need a drawing software to create a professional looking cross-functional charts, ConceptDraw with its Arrows10 Technology - is more than enough versatility to draw any type of diagram with any degree of complexity.Use templates with process maps, diagrams, charts to get the drawing in minutes.
Cross Functional Flowchart for Business Process Mapping
Start your business process mapping with conceptDraw DIAGRAM and its Arrows10 Technology. Creating a process map, also called a flowchart, is a major component of Six Sigma process management and improvement. Use Cross-Functional Flowchart drawing software for business process mapping (BPM).Use a variety of drawing tools, smart connectors and shape libraries to create flowcharts of complex processes, procedures and information exchange. Define and document basic work and data flows, financial, production and quality management processes to increase efficiency of you business.
How to Make SWOT Analysis in a Word Document
A SWOT Analysis is a popular strategic planning tool used to evaluate the Strengths, Weaknesses, Opportunities, and Threats involved in any businesses. You can export your SWOT mind map into a MS Word document, which makes using SWOT mind map easier if you need to collaborate it with other people.ConceptDraw products across any platform, meaning you never have to worry about compatibility again. ConceptDraw MINDMAP allows you to make SWOT analysis on PC or macOS operating systems.
Cross-Functional Flowcharts
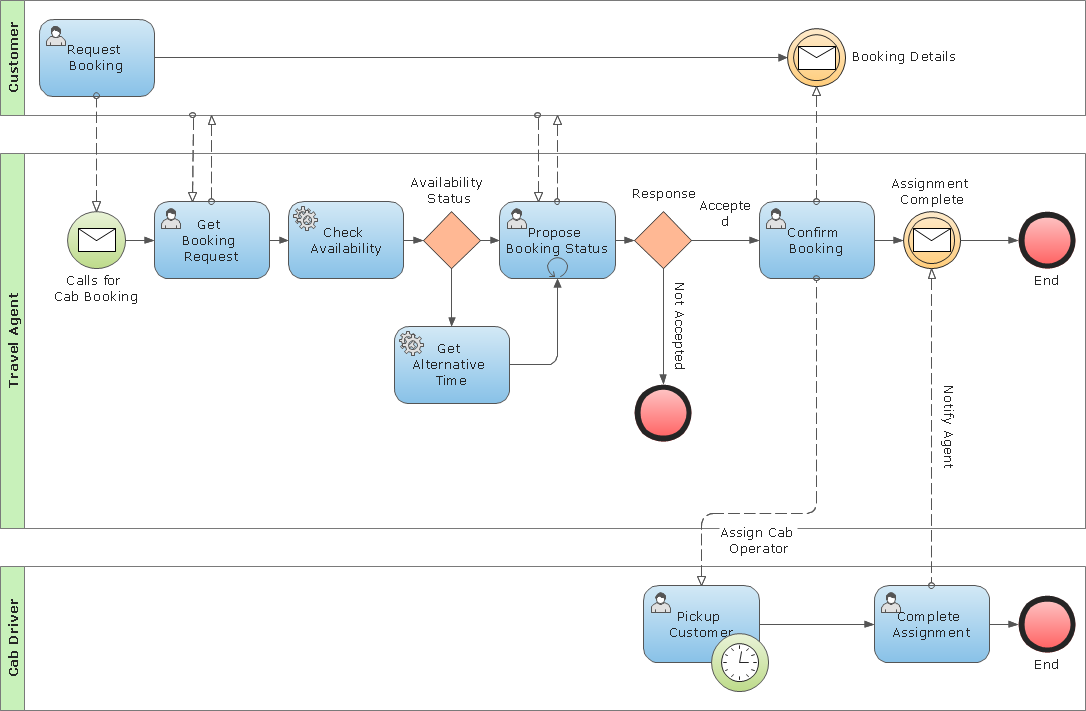
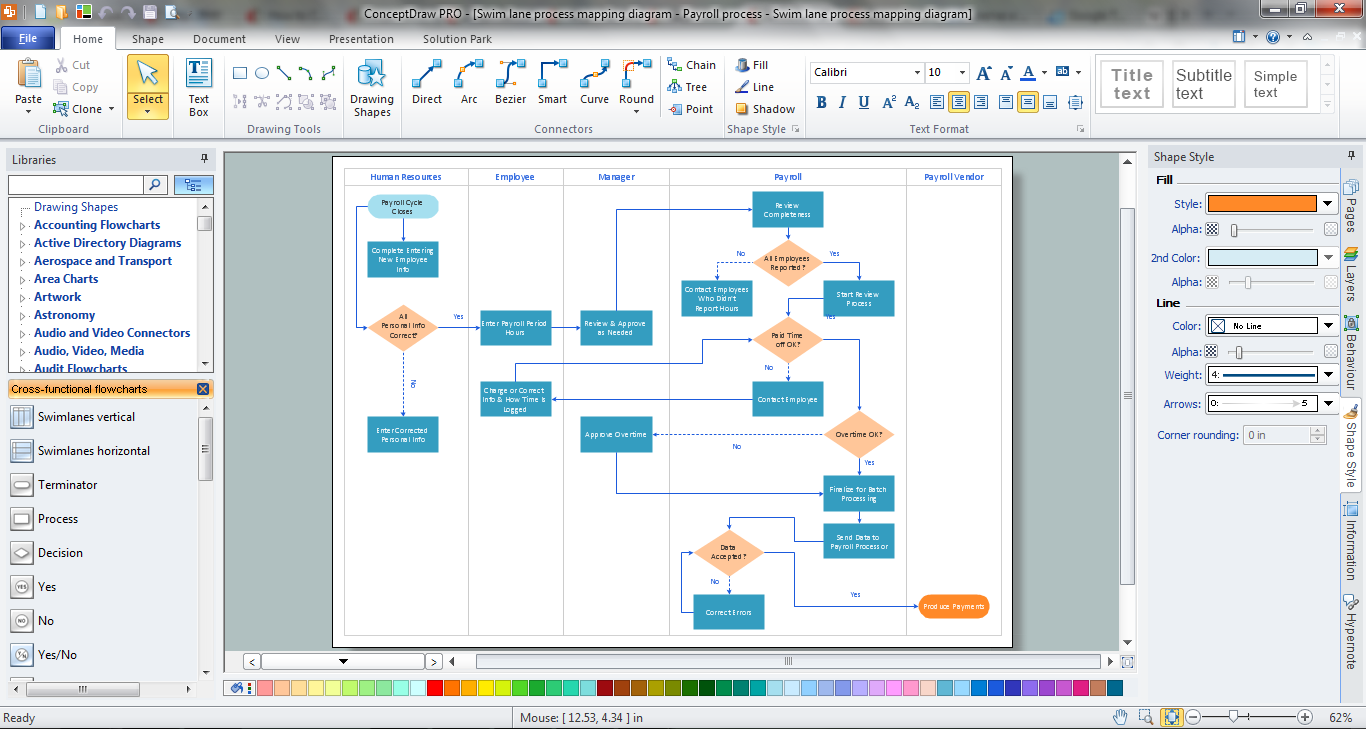
Cross-functional flowcharts are powerful and useful tool for visualizing and analyzing complex business processes which requires involvement of multiple people, teams or even departments. They let clearly represent a sequence of the process steps, the order of operations, relationships between processes and responsible functional units (such as departments or positions).
7 Continents Map
A continent is a large area of land washed by the seas. There are 7 continents on the Earth: Asia, Africa, North America, South America, Antarctica, Europe, and Australia. If you want create the 7 Continents Map, we offer you incredibly useful tool for this - ConceptDraw DIAGRAM diagramming and vector drawing software extended with Continent Maps Solution from the Maps Area of ConceptDraw Solution Park.BCG Matrix
The growth–share matrix (BCG Matrix) was created by Bruce D. Henderson for the Boston Consulting Group in 1970 to help corporations to analyze their business units and to help the company allocate resources. How is it easy design the BCG Matrices in ConceptDraw DIAGRAM diagramming and vector drawing software supplied with unique Matrices Solution from the Marketing Area of ConceptDraw Solution Park.Cross-Functional Flowchart (Swim Lanes)
ConceptDraw DIAGRAM diagramming software provides vector shapes and connector tools for quick and easy drawing diagrams for business, technology, science and education.Use flowchart maker of ConceptDraw DIAGRAM enhanced with solutions from ConceptDraw Solution Park to create diagrams to present and explain structures, process flows, logical relationships, networks, design schemes and other visually organized information and knowledge.
Business Process Modeling Notation Template
Create business process diagrams (BPMN 2.0.) with ConceptDraw using professional looking templates. ConceptDraw is business process improvement tools.Cross Functional Flowchart
ConceptDraw DIAGRAM extended with Cross-Functional Flowcharts Solution from the Business Processes Area is the best software for quick and easy designing Cross Functional Flowchart of any complexity. Make sure in it right now!Value Stream Mapping Symbols
VSM symbols are the best for a production process designing. The entire Value Stream Mapping method uses a graphical representation of the manufacturing process, factors' pros and cons, that all stakeholders can easily understand. Value Stream Mapping is a graphical technique that provides possibilities to improve analysis of a manufacturing process, at the stage of the transferring information or materials that required to deliver a product or service to the customer.Sales Process Map
You need create a Sales Process Map? Use the ConceptDraw DIAGRAM software which is ideal for the sales process management, marketing and engineering thanks to the powerful Sales Flowcharts solution from the Marketing area of ConceptDraw Solution Park.SWOT Analysis
The SWOT Analysis provides information that is helpful in matching the firm's resources and capabilities to the competitive environment in which it operates. As such, it is instrument in strategy formulation and selection. SWOT analysis is a method of strategic planning which identifies the factors internal and external environment of the firm and divides them into 4 categories: strengths, weaknesses, opportunities and threats. The ConceptDraw DIAGRAM and MINDMAP software allow professional to make well-designed SWOT matrix in minutes.Business Process Mapping — How to Map a Work Process
ConceptDraw DIAGRAM is a world-class diagramming platform that lets you display, communicate, and present dynamically. It′s powerful enough to draw everything from basic flowcharts to complex engineering schematics.Video tutorials on ConceptDraw products. Try it today!
Basic Flowchart Examples
ConceptDraw DIAGRAM is a business flowchart software includes the wide flowchart examples package.Flowchart Examples and Templates
ConceptDraw provides a wide variety of examples such as flowcharts, organizational charts, business charts, and lots more. Please choose any examples you are interested in, alternatively download them for free; you will need to install ConceptDraw to view them. As you will see, ConceptDraw is very powerful, you can use more than 10000 symbols, examples, and many pre-drawn templates, to create your own spectacular flowcharts, business diagrams, and lots more, effortlessly, and in no time at all.- Opportunity Map Sample
- Opportunity flowchart - Template | Replacing engine oil - Opportunity ...
- How to Make an Ansoff Matrix Template in ConceptDraw PRO | New ...
- Strength Weakness Opportunity Threat Template
- Marketing | How to Make Soccer Position Diagram Using ...
- New business opportunity SWOT analysis matrix - Template portrait ...
- Small business consultancy SWOT analysis matrix | How to Create ...
- Example Opportunity
- SWOT Template | New business opportunity SWOT analysis matrix ...
- Form Maker | New business opportunity SWOT analysis matrix ...
- Basic Flowchart Symbols and Meaning | New business opportunity ...
- Ansoffs Opportunity Matrix
- How to Create SWOT Analysis Template Using ConceptDraw PRO ...
- Positioning map | Positioning Map | Business Tools Perceptual ...
- Replacing engine oil - Opportunity flowchart | Cross Functional ...
- SWOT Analysis Solution - Strategy Tools | TOWS Matrix | TOWS ...
- SWOT Analysis | SWOT analysis Software & Template for Macintosh ...
- Form Maker | New business opportunity SWOT analysis matrix ...
- Replacing engine oil - Opportunity flowchart | Cross Functional ...
- Process Flowchart | Cross-functional flowchart Templates portrait ...
- ERD | Entity Relationship Diagrams, ERD Software for Mac and Win
- Flowchart | Basic Flowchart Symbols and Meaning
- Flowchart | Flowchart Design - Symbols, Shapes, Stencils and Icons
- Flowchart | Flow Chart Symbols
- Electrical | Electrical Drawing - Wiring and Circuits Schematics
- Flowchart | Common Flowchart Symbols