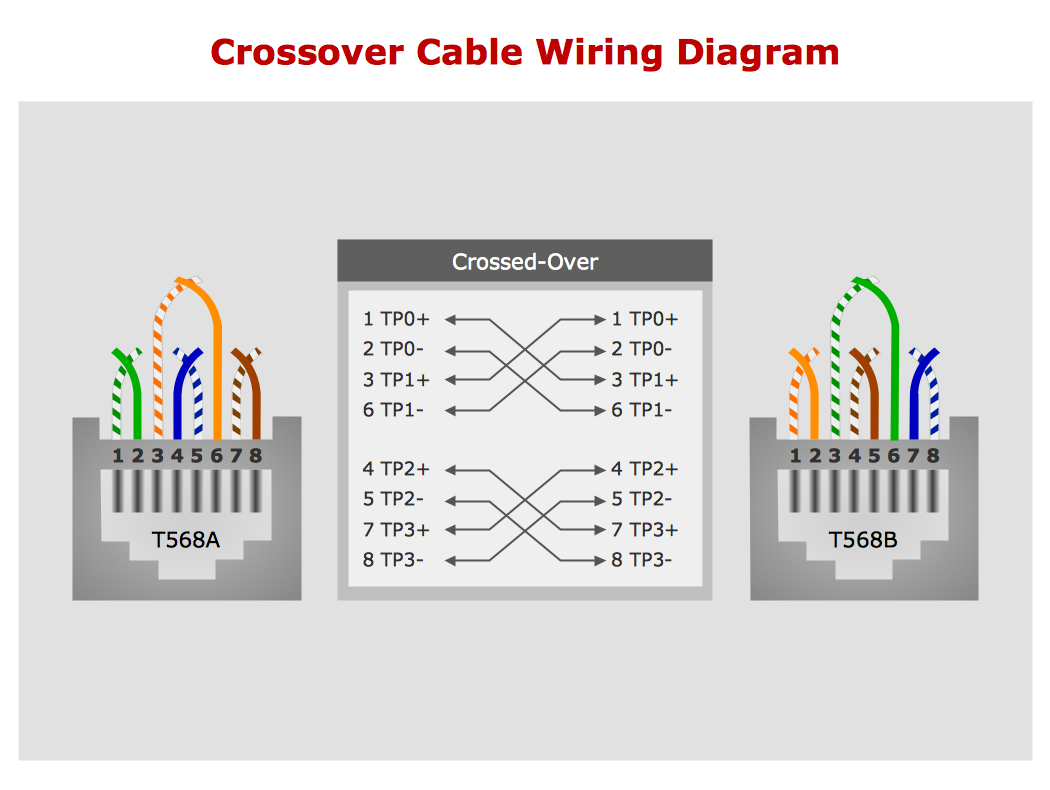
Network wiring cable. Computer and Network Examples
To connect two or more network devices are used the network cables. There are more different types of the network cables: Coaxial cable, Optical fiber cable, Twisted Pair, Ethernet crossover cable, Power lines and others. They are used depending of the network topology, size, protocol. This example was created in ConceptDraw DIAGRAM using the Computer and Networks solution from the Computer and Networks area of ConceptDraw Solution Park.
Wiring Diagrams with ConceptDraw DIAGRAM
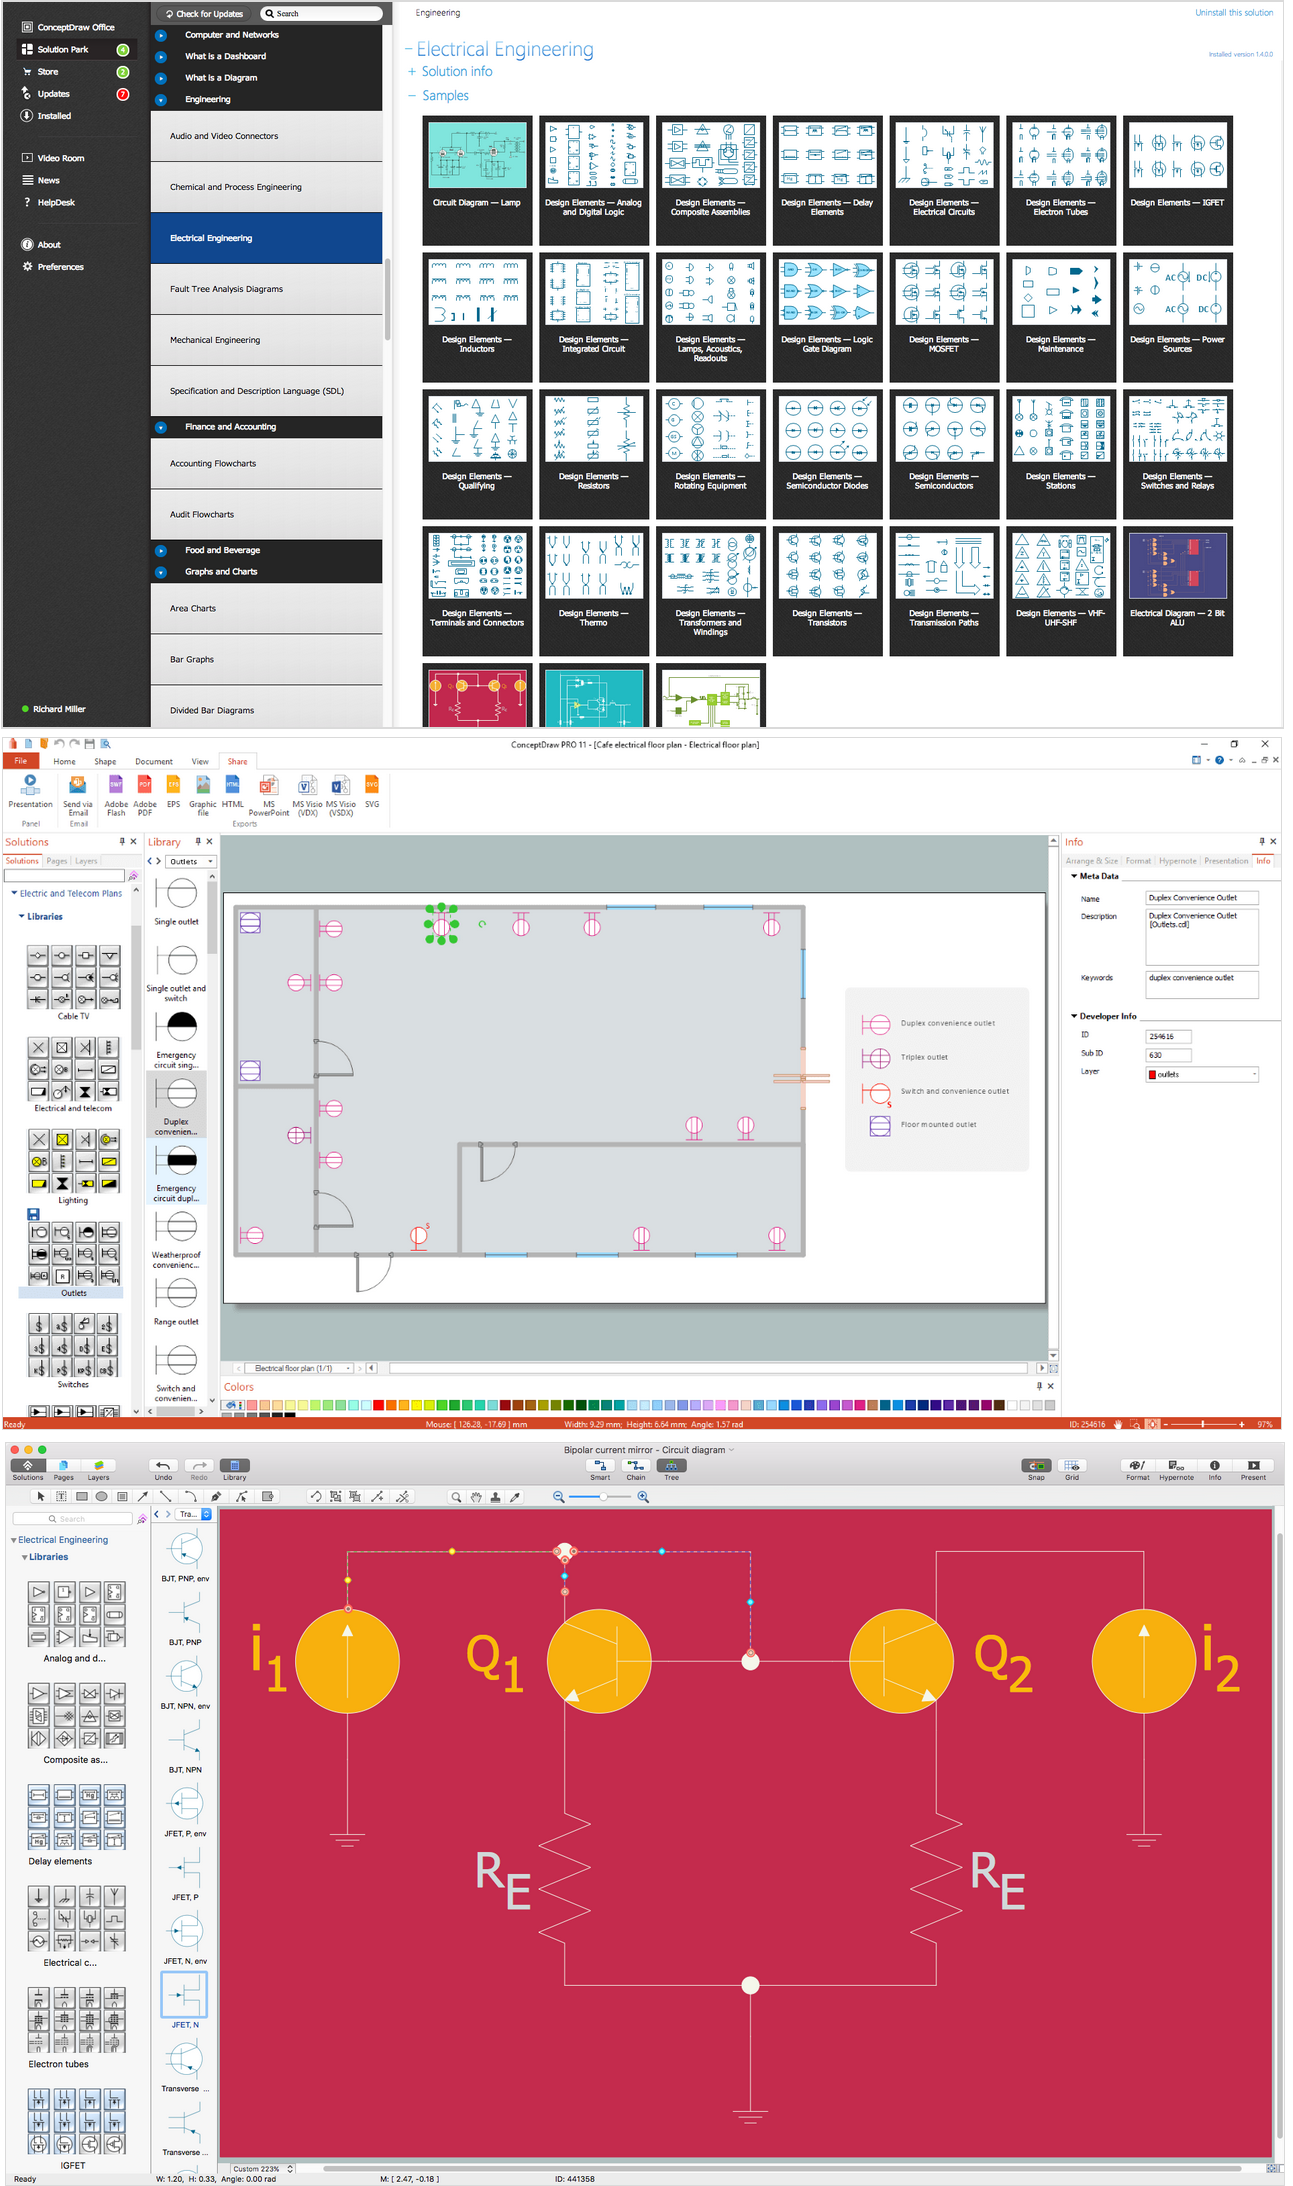
A Wiring Diagram is a comprehensive schematic that depicts the electrical circuit system, shows all the connectors, wiring, signal connections (buses), terminal boards between electrical or electronic components and devices of the circuit. Wiring Diagram illustrates how the components are connected electrically and identifies the wires by colour coding or wire numbers. These diagrams are necessary and obligatory for identifying and fixing faults of electrical or electronic circuits, and their elimination. For designing Wiring Diagrams are used the standardized symbols representing electrical components and devices. ConceptDraw Solution Park offers the Electrical Engineering solution from the Engineering area with 26 libraries of graphics design elements and electrical schematic symbols for easy drawing various Wiring Diagrams, Electrical Circuit and Wiring Blueprints, Electrical and Telecom schematics of any complexity, Electrical Engineering Diagrams, Power Systems Diagrams, Repair Diagrams, Maintenance Schemes, etc. in ConceptDraw DIAGRAM software.Basic Diagramming
Mathematics is an exact science, which studies the values, spatial forms and quantitative relations. It is a science, in which is built large number of various diagrams, charts and graphs that present the material in a clear, visual and colorful form, help to analyze the information and to make certain conclusions. A diagram is a graphical representation of data using the linear segments or geometric shapes, which allows to evaluate the ratio of several values. Depending on the types of solved tasks are used the diagrams of different kinds. A graph is a diagram that shows quantitative dependencies of various processes using the curves. ConceptDraw DIAGRAM is a powerful intelligent and multifunctional vector engine for drawing different Mathematical diagrams and graphs, Mathematical illustrations, complex and simple Diagram mathematics, Flowcharts of equation solving process, Line graphs, Scatter plots, Histograms, Block diagrams, Bar charts, Divided bar diagrams, Pie charts, Area charts, Circular arrows diagrams, Venn diagrams, Bubble diagrams, Concept maps, and many others.
- Cisco Optical . Cisco icons , shapes , stencils and symbols | Cisco ...
- Process Flowchart | Cisco Optical . Cisco icons , shapes , stencils and ...
- Network Tap Visio Stencil
- Cisco Optical . Cisco icons , shapes , stencils and symbols | Cisco ...
- Electrical Diagram Software | Cisco Optical . Cisco icons , shapes ...
- How To use House Electrical Plan Software | Electrical Symbols ...
- Cable TV - Vector stencils library | Cisco Optical . Cisco icons ...
- Tap Symbol Used In Building Planning Drawing
- Cisco optical - Vector stencils library | Cisco Optical . Cisco icons ...
- How To use House Electrical Plan Software | Electrical Symbols ...
- Cisco Optical . Cisco icons , shapes , stencils and symbols | Cisco ...
- Electrical Symbols — Integrated Circuit | ConceptDraw PRO ...
- Cable TV - Vector stencils library | Cisco optical - Vector stencils ...
- Cisco Optical . Cisco icons , shapes , stencils and symbols | Cisco ...
- Cable TV - Vector stencils library | Network Glossary Definition ...
- Cisco Optical . Cisco icons , shapes , stencils and symbols | Star ...
- Cable TV - Vector stencils library | How To use House Electrical Plan ...
- Cisco Optical . Cisco icons , shapes , stencils and symbols | Cable TV ...
- Optical Fibre Connector Symbol
- Design elements - Cable TV (CATV) | Cable TV - Vector stencils ...


