Basic Flowchart Symbols and Meaning
Flowcharts are the best for visually representation the business processes and the flow of a custom-order process through various departments within an organization. ConceptDraw PRO diagramming and vector drawing software extended with Flowcharts solution offers the full set of predesigned basic flowchart symbols which are gathered at two libraries: Flowchart and Flowcharts Rapid Draw. Among them are: process, terminator, decision, data, document, display, manual loop, and many other specific symbols. The meaning for each symbol offered by ConceptDraw gives the presentation about their proposed use in professional Flowcharts for business and technical processes, software algorithms, well-developed structures of web sites, Workflow diagrams, Process flow diagram and correlation in developing on-line instructional projects or business process system. Use of ready flow chart symbols in diagrams is incredibly useful - you need simply drag desired from the libraries to your document and arrange them in required order. There are a few serious alternatives to Visio for Mac, one of them is ConceptDraw PRO. It is one of the main contender with the most similar features and capabilities.
Flowchart design. Flowchart symbols, shapes, stencils and icons
A flowchart is a type of diagram which represents an algorithm, process or workflow, displays the steps as boxes of various kinds and depicts their order by connecting them with arrows. Any business graphic document will be more colorful and understandable if will use professional-looking and visual diagrams and flowcharts. Flowchart design gives versatile presenting and explaining of the process. ConceptDraw PRO flowchart software enhanced with Flowcharts solution helps effectively make Flowchart Design. Use of predesigned flowchart symbols and bright color palette offers a fresh view and favorably distinguishes the flowcharts designed in ConceptDraw PRO from the black and white flowcharts on a paper. Preferably to use no more than three or four colors and apply identical for the same shape types. The best flowchart design can be achieved by starting with Flowchart template, or any of suitable ready examples or samples offered in ConceptDraw STORE, open one of them and enter the proper text into each Flowchart shape. Each symbol of the flowchart has a definition that can't be changed. This means that all flowcharts shapes can be grouped in according to their meaning. Users with ConceptDraw PRO flowchart software can style groups of symbols with close definitions by color sets chosen from complementary palette. Almost all workflows can be depicted as a flowchart. Colored diagrams are more light for perception of the certain information, this is part of flowchart design. Bright colors need to be used in the key points of Decision symbols, to focus attention on their importance for whole process flow.
Business Process Flowchart Symbols
Business process modeling is known in the corporate world as an excellent tool which can speak. Business process flowcharts, diagrams and maps are used to define the business processes in terms of inputs and outputs, to visually represent and effectively explain complex business processes of an enterprise, and also showcase decisions on a single piece of paper. The process of business process mapping supposes the use of special business process flowchart symbols predefined by Business Process Modeling Notation (BPMN) and taking their roots from the data processing diagrams and programming flow charts. In other words the BPMN standard notation is a common language used for business process design and implementation, that guarantees a clarity of designed Business Process Flowcharts for all business analysts, technical developers and business managers. The ability to create professionally-looking Business Process flowcharts, maps and diagrams, is provided by powerful ConceptDraw PRO software and the Business Process Mapping solution included to ConceptDraw Solution Park.Graphical Symbols to use in EPC diagrams
Event-Driven Process Chain Diagrams for improvement throughout an organisation. ConceptDraw PRO - software that reduces the time needed to create a business process model.Diagramming Software for Design Business Process Diagrams
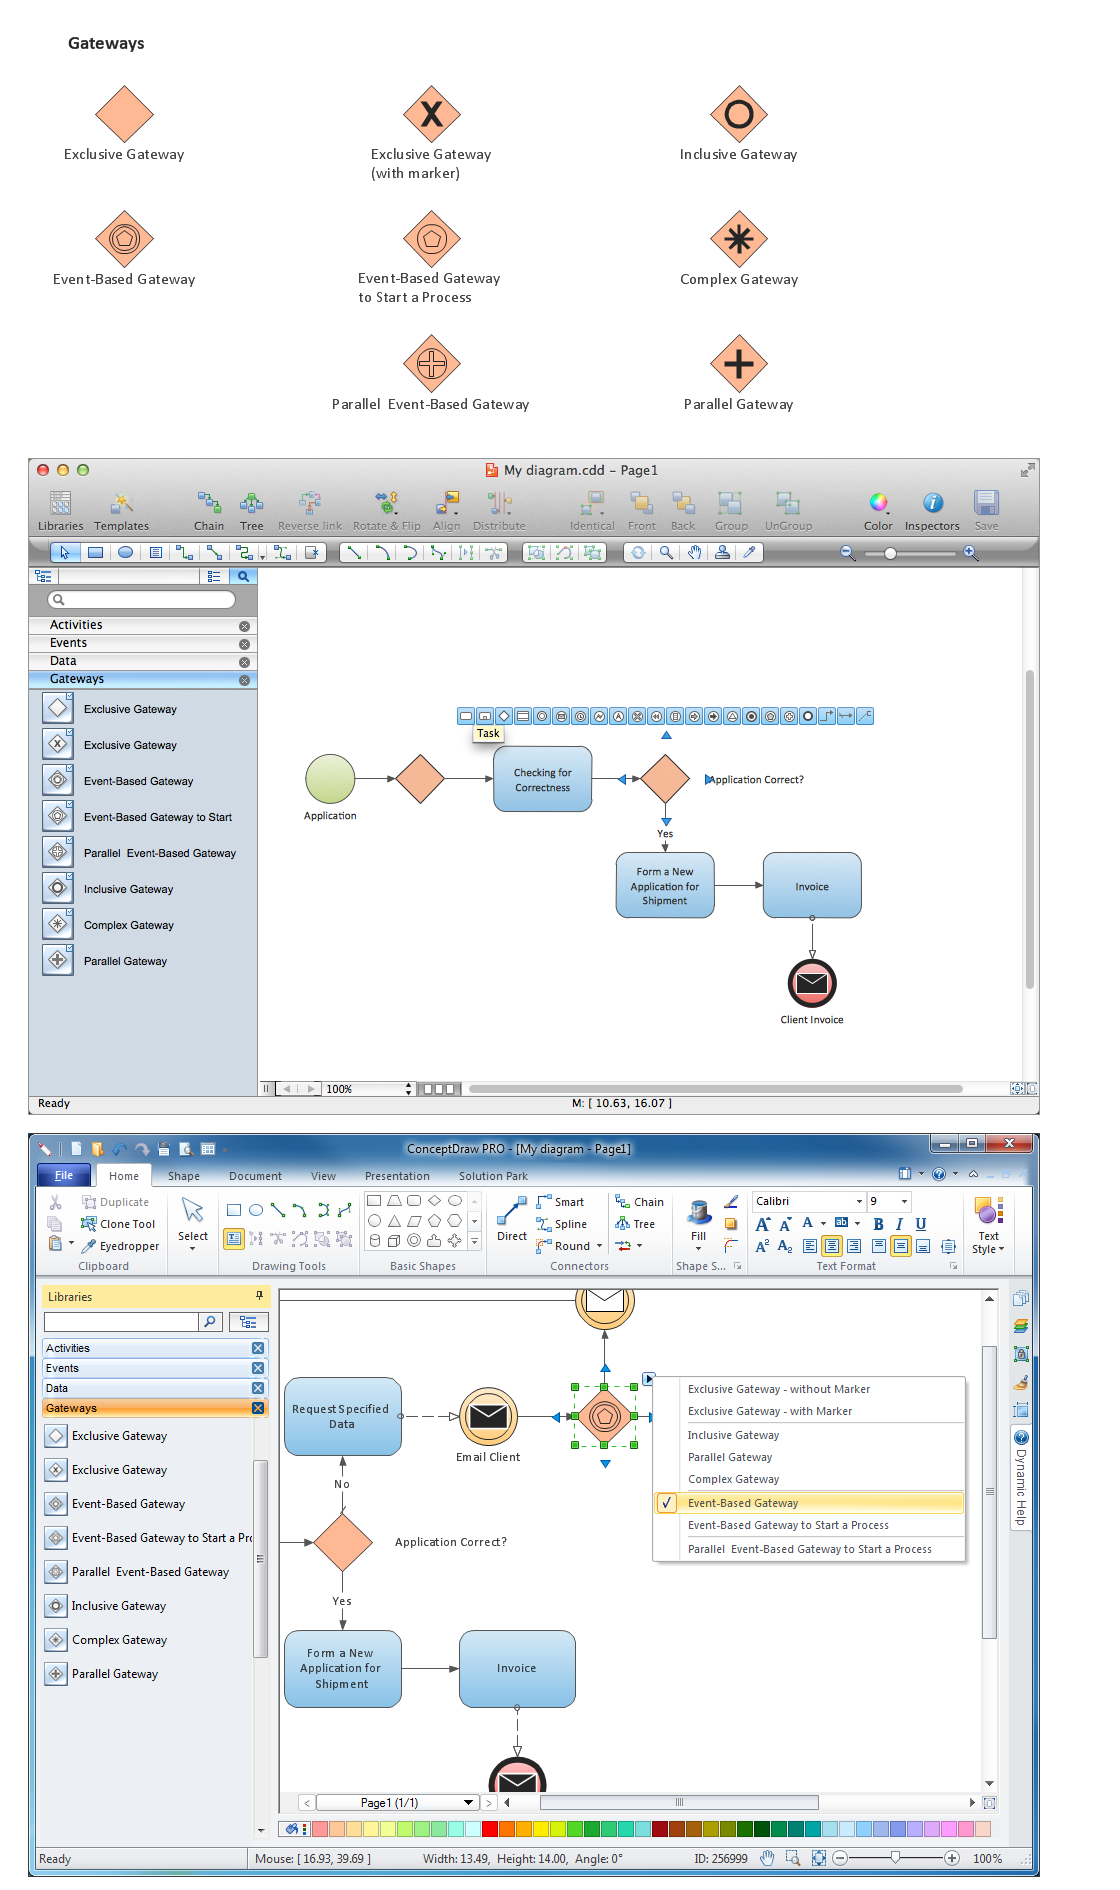
Create professional business process diagrams using ConceptDraw Gateways library with 8 objects from BPMN.
HelpDesk
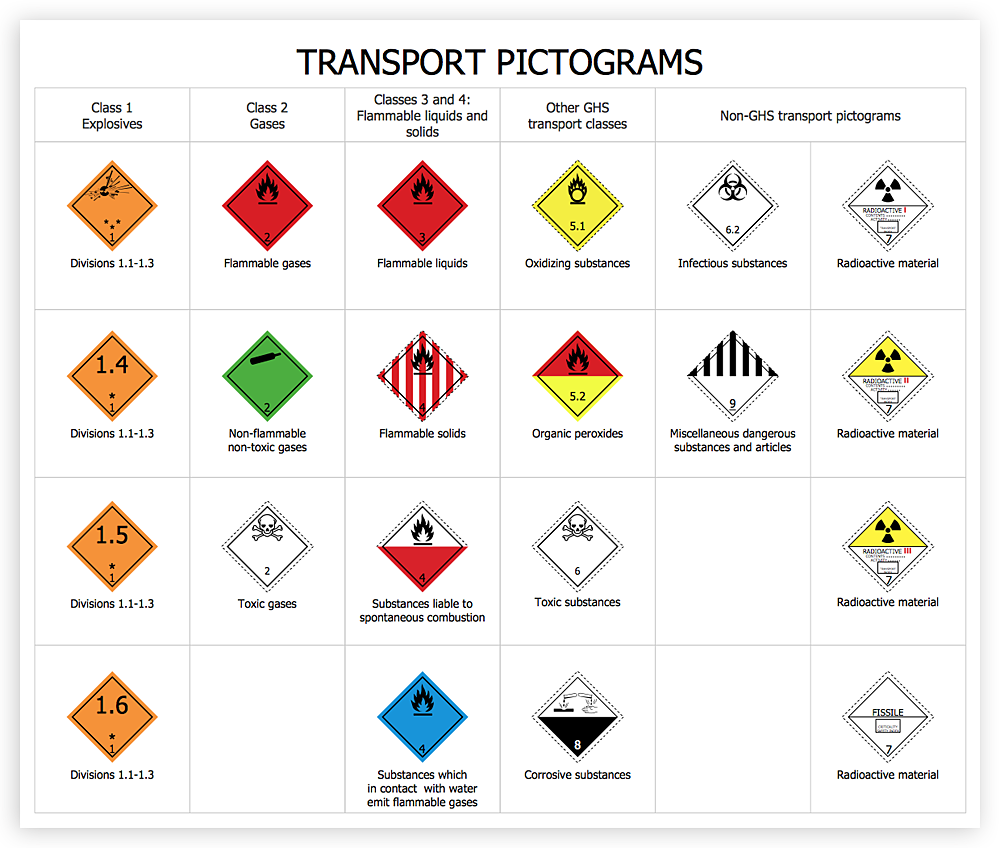
How To Design Warning Infographics Using Transport Hazard Pictograms
A hazard pictogram is intended to provide information about the hazard that can cause a damage of a human health or the environment. GHS Hazard pictogram consists from a standard hazard symbol placed to the shape of a red diamond with a white background. GHS Hazard Pictograms solution from the ConceptDraw Solution Park includes the set of standardized GHS hazard pictograms. It can be used for creating safety infographics, warning announcements, labels and regulatory documentation containing the elements of OSHA HAZCOM Standard.Swim Lane Flowchart Symbols
Use the set of special professionally developed swim lane flowchart symbols - single, multiple, vertical and horizontal lanes from the Swimlanes and Swimlanes BPMN 1.2 libraries from the Business Process Diagram solution, the Swim Lanes library from the Business Process Mapping solution as the perfect basis for your Swim Lane Flowcharts of processes, algorithms and procedures.Flowchart Programming Project. Flowchart Examples
Create you own flow charts of process-driven software applications using the ConceptDraw PRO diagramming and vector drawing software extended with the Cross-Functional Flowcharts solution from the Business Processes area of ConceptDraw Solution Park. The programming project flow chart example shows the logical process of execution.
 Cross-Functional Flowcharts
Cross-functional flowcharts are powerful and useful tool for visualizing and analyzing complex business processes which requires involvement of multiple people, teams or even departments. They let clearly represent a sequence of the process steps, the order of operations, relationships between processes and responsible functional units (such as departments or positions).
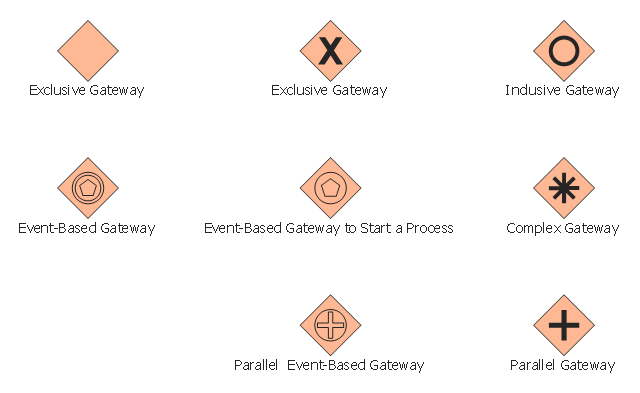
The vector stencils library "Gateways" contains 8 symbols of exclusive, event-based, parallel, inclusive and complex gateways.
Use these shapes for creating the business process diagrams using the ConceptDraw PRO diagramming and vector drawing software.
"Gateway.
A gateway is represented with a diamond shape and determines forking and merging of paths, depending on the conditions expressed.
Exclusive.
Used to create alternative flows in a process because only one of the paths can be taken, it is called exclusive.
Event Based.
The condition determining the path of a process is based on an evaluated event.
Parallel.
Used to create parallel paths without evaluating any conditions.
Inclusive.
Used to create alternative flows where all paths are evaluated.
Exclusive Event Based.
An event is being evaluated to determine which of mutually exclusive paths will be taken.
Complex.
Used to model complex synchronization behavior.
Parallel Event Based.
Two parallel process are started based on an event but there is no evaluation of the event." [Business Process Model and Notation. Wikipedia]
The example "Design elements - Gateways BPMN 2.0" is included in the Business Process Diagram solution from the Business Processes area of ConceptDraw Solution Park.
- Vector Arrow Orange
- Arrows Donut Chart Shape
- Basic Flowchart Symbols and Meaning | Cross Functional Flowchart ...
- Accounting Flowchart Symbols | Basic Flowchart Symbols and ...
- Bpmn 2 0 Gateway Symbols
- Flowchart Definition | Basic Flowchart Symbols and Meaning | Types ...
- How to Create a Business Process Diagram | Network Gateway ...
- Design elements - Gateways BPMN 2.0
- Orange Triangle Png
- IDEF3 Standard | Design elements - Gateways BPMN 2.0 | Design ...


