Chemistry Equation Symbols
If you are related with chemistry in you work or education activity, you need often draw various illustrations with chemistry equations. ConceptDraw DIAGRAM diagramming and vector drawing software offers you the Chemistry solution from the Science and Education area. Chemistry solution provides the Chemical Drawings Library with large quantity of vector chemistry equation symbols to help you create professional looking chemistry diagrams quick and easy.DFD Flowchart Symbols
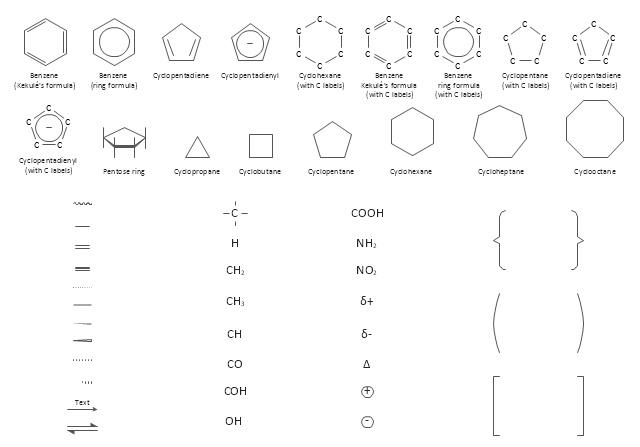
A Data Flow Diagram (DFD) is a graphical technique which allows effectively model and analyze the information processes and systems. The ability to fast and easy create the DFDs is made possible with Data Flow Diagrams solution from the Software Development area of ConceptDraw Solution Park. For designing the Data Flow Diagrams are used simple DFD flowchart symbols which are connected each other by arrows depicting the data flow from one step to another.The vector stencils library "Chemical drawings" contains 81 symbols of organic compounds and functional groups for chemical drawing.
Use it to draw structural formulas of organic molecules, schemes of chemical reactions and organic chemistry diagrams.
"Structural drawings.
Organic molecules are described more commonly by drawings or structural formulas, combinations of drawings and chemical symbols. The line-angle formula is simple and unambiguous. In this system, the endpoints and intersections of each line represent one carbon, and hydrogen atoms can either be notated explicitly or assumed to be present as implied by tetravalent carbon. The depiction of organic compounds with drawings is greatly simplified by the fact that carbon in almost all organic compounds has four bonds, nitrogen three, oxygen two, and hydrogen one. ...
Organic reactions.
Organic reactions are chemical reactions involving organic compounds. While pure hydrocarbons undergo certain limited classes of reactions, many more reactions which organic compounds undergo are largely determined by functional groups. The general theory of these reactions involves careful analysis of such properties as the electron affinity of key atoms, bond strengths and steric hindrance. These issues can determine the relative stability of short-lived reactive intermediates, which usually directly determine the path of the reaction.
The basic reaction types are: addition reactions, elimination reactions, substitution reactions, pericyclic reactions, rearrangement reactions and redox reactions. ...
Each reaction has a stepwise reaction mechanism that explains how it happens in sequence - although the detailed description of steps is not always clear from a list of reactants alone.
The stepwise course of any given reaction mechanism can be represented using arrow pushing techniques in which curved arrows are used to track the movement of electrons as starting materials transition through intermediates to final products." [Organic chemistry. Wikipedia]
The chemical symbols example "Design elements - Chemical drawings" was created using the ConceptDraw PRO software extended with the Chemistry solution from the Science and Education area of ConceptDraw Solution Park.
Chemical Engineering
ConceptDraw DIAGRAM is a powerful diagramming and vector drawing software. Extended with Chemical and Process Engineering Solution from the Industrial Engineering Area of ConceptDraw Solution Park, it became the best Chemical Engineering software.UML Class Diagram Tutorial
The Rapid UML Solution from the Software Development area of ConceptDraw Solution Park helps you to create the UML Class Diagrams quick and easy using ConceptDraw DIAGRAM diagramming and vector drawing software.Educational Technology Tools
What are the favorite educational technology tools and techniques for teachers? Of course these are pictures, images and education infographics! ConceptDraw DIAGRAM software supplied with Education Infographics Solution from the Business Infographics Area provides powerful drawing tools to help design the education infographics of any complexity.Design Element: Basic Network for Network Diagrams
ConceptDraw DIAGRAM is perfect for software designers and software developers who need to draw Basic Network Diagrams.
Finite State Machine
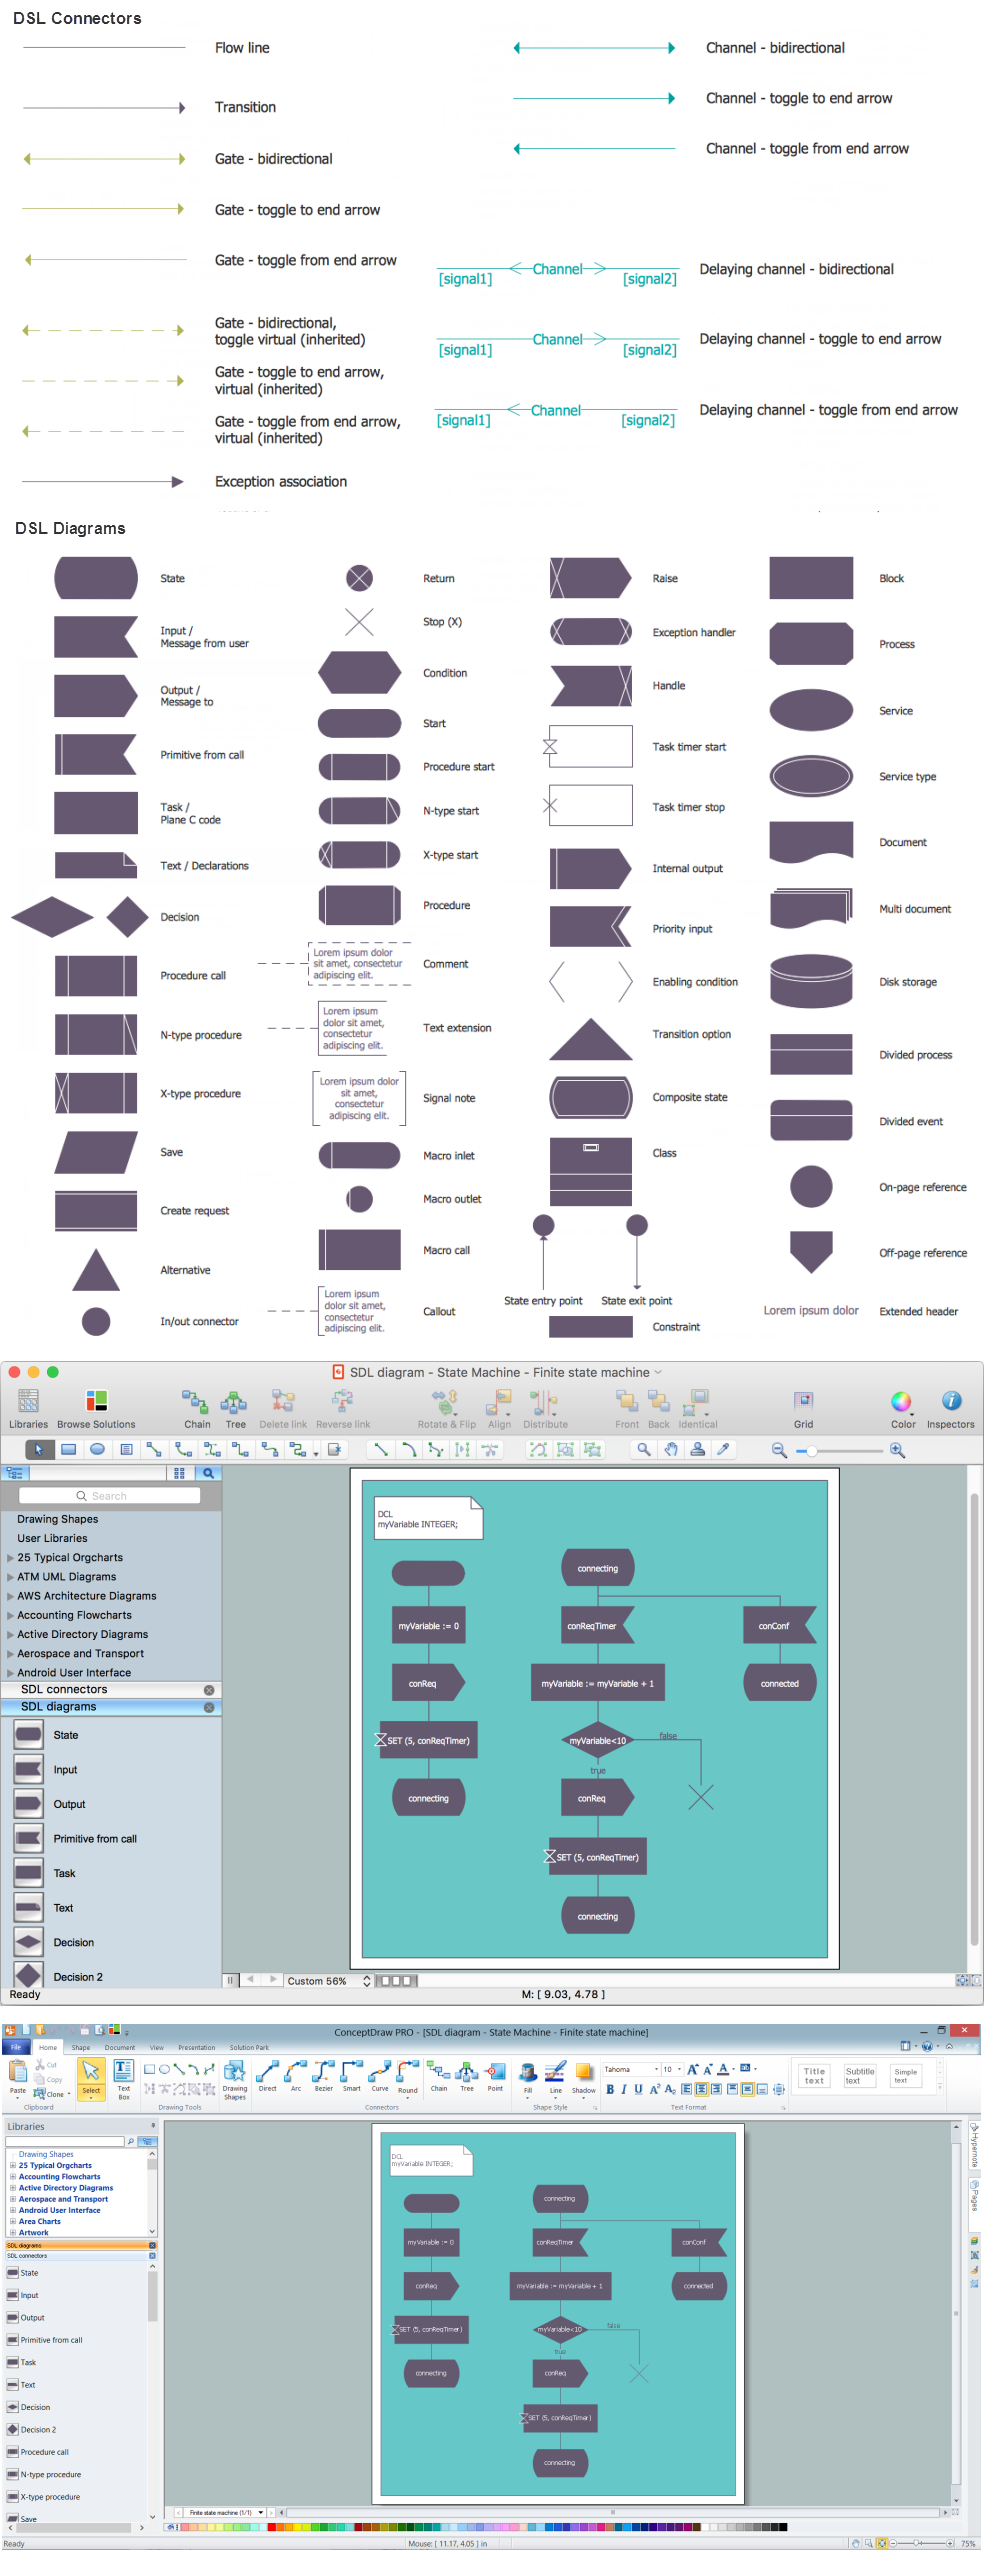
You need design a Finite State Machine (FSM) diagram and dream to find a powerful software to make it easier? ConceptDraw DIAGRAM extended with Specification and Description Language (SDL) Solution from the Industrial Engineering Area of ConceptDraw Solution Park is the best software for achievement this goal.How to Draw Pictorial Chart. How to Use Infograms
How to draw pictorial chart quick, easy and effective? ConceptDraw DIAGRAM offers the unique Pictorial Infographics Solution that will help you! Pictorial Infographics solution contains large number of libraries with variety of predesigned vector pictograms that allows you design infographics in minutes. There are available 10 libraries with 197 vector pictograms.Basic Diagramming
Mathematics is an exact science, which studies the values, spatial forms and quantitative relations. It is a science, in which is built large number of various diagrams, charts and graphs that present the material in a clear, visual and colorful form, help to analyze the information and to make certain conclusions. A diagram is a graphical representation of data using the linear segments or geometric shapes, which allows to evaluate the ratio of several values. Depending on the types of solved tasks are used the diagrams of different kinds. A graph is a diagram that shows quantitative dependencies of various processes using the curves. ConceptDraw DIAGRAM is a powerful intelligent and multifunctional vector engine for drawing different Mathematical diagrams and graphs, Mathematical illustrations, complex and simple Diagram mathematics, Flowcharts of equation solving process, Line graphs, Scatter plots, Histograms, Block diagrams, Bar charts, Divided bar diagrams, Pie charts, Area charts, Circular arrows diagrams, Venn diagrams, Bubble diagrams, Concept maps, and many others.
- Organic Chemistry Symbols
- Organic Chemistry Symbols | Science Lab Instruments List
- Organic Chemistry Symbols | Organic Chemistry Lab Equipment ...
- List Of Chemical Symbols
- Organic Chemistry Symbols | Chemistry Symbols and Meanings ...
- List The Uses And Diagram Of Chemistry Laboratory Apparatus
- Physics Diagrams | Chemistry Symbols and Meanings | Chemistry ...
- Chemistry Symbols and Meanings | Organic Chemistry Symbols ...
- Process Engineering | List Of Symbols Of All Mineral Processing ...


.png)


