Orgchart
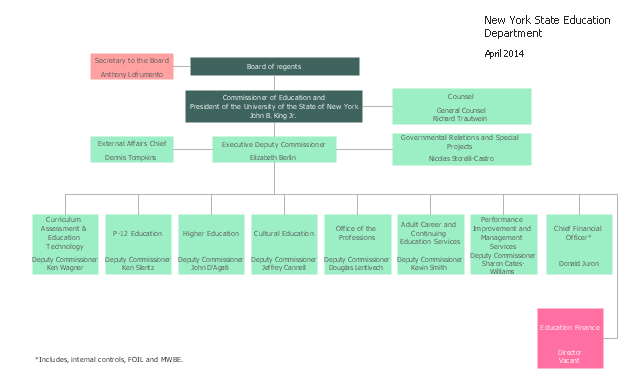
Workforce planning is strategically important for each company, organization, enterprise, and corporation, non important it is business, commercial, non-profit or government organization. Organizational Chart or Orgchart is a type of diagram that is successfully used to graphically illustrate the structure of an organization and also relationships between its parts. There are three different types of Orgcharts: hierarchical, matrix and flat. ConceptDraw DIAGRAM diagramming and vector drawing software supplied with Organizational Charts Solution from Management Area is the best for easy designing professional-looking Orgcharts. This solution provides you the predesigned samples and Organizational Chart library with ready-to-use vector objects required for Orgchart design. It also offers the most simple way of drawing - the possibility to start with one of built-in Orgchart templates. Typically Orgcharts require for regular updating and making modifications, in ConceptDraw DIAGRAM it is fast and easy, the blocks are editable and remain connected when they are moved.This organization chart sample was created on the base of the figure from the website of New York State Education Department (NYSED).
"The New York State Education Department is part of the University of the State of New York (USNY), one of the most complete, interconnected systems of educational services in the United States."
[oms.nysed.gov/ orgchart/ ]
The organizational chart example "New York State Education Department" was created using the ConceptDraw PRO diagramming and vector drawing software extended with the Organizational Charts solution from the Management area of ConceptDraw Solution Park.
Organizational Charts with ConceptDraw DIAGRAM
Organizational chart or Orgchart is a diagram that depicts the structure of an organization using the terms of work responsibility and rank position. It is a useful and convenient format to visually illustrate the relationships within an organization, which is moreover applicable for organization of any size. Typically, an Organizational chart is constructed from the rectangular object blocks, which represent a job title, a person's name and relationships associated with them. You looks for the powerful Orgchart software? ConceptDraw DIAGRAM software is exactly what you've been searching long. Extended with Organizational Charts Solution, ConceptDraw DIAGRAM offers great-looking examples and samples of Orgcharts, built-in templates and various types of predesigned vector block objects and connectors for creation all kinds of Organizational Charts - from simple to complex multi-page. When designing the chart for large organization with complex branched structure, may be convenient to divide it into few smaller charts.Flowcharting Software
A flowchart is a useful type of diagram quite popular in many areas of science and business, which represents some algorithm, workflow or process. ConceptDraw DIAGRAM diagramming and vector graphic software extended with Flowcharts solution from the "Diagrams" area of ConceptDraw Solution Park is also ideal flowcharting software with powerful tools that assist in easily making the Flowcharts of different types and directions, in representing the flowchart steps and describing the flowchart processes, in realizing the flowchart constructions, creating the process flow models, designing the data flow diagrams, and many other flowcharting related diagrams. ConceptDraw DIAGRAM software maximally facilitates the drawing process by means of included predesigned vector objects, which only need to be dragged to your ConceptDraw document from the corresponding library and connected with smart connectors. This way lets equally easy make the simple flowcharts, as well as flowcharts of complex processes and procedures.HelpDesk
How to Make a Workflow Diagram
With the help of a workflow diagram, you can visually describe the tasks, documents, people responsible for execution at each stage of the workflow. Modern workflow diagrams have a specific focus on quality control. This can apply to the quality of inputs and outputs related to a process, or to the actual efficiency of the workflow itself. Different sectors of business use different diagramming techniques, and this has given rise to a number of methods that have become recognized in their own right as industry standards. ConceptDraw DIAGRAM, with the Workflow Diagrams solution, is ideal for creating diagrams of this type. Its RapidDraw technology takes the strain from diagram arrangement, allowing users to create their process steps with a single click, ideal for generating the many repeatable tasks that can make up a workflow. The Workflow Diagrams solution complements this feature with a library of selected icons to represent various steps.Flowchart Software
Flowchart is a simple diagram, map or graphical schematic representation the sequence of actions within a process. It is ideal for displaying how a process currently flows or can function ideally. The Flowcharts let define the steps and boundaries of a process, uncover problems or miscommunications. The Flowcharts are widely used in education, software development, business, economics, thanks to their visuality they are ideal for presentations, reports, for using on conferences to help the audience comprehend the content better, or easy find flaws in a process flow diagrams. ConceptDraw DIAGRAM is professional flowcharts software and feature-rich flowchart maker, which supports Mac OS X and Windows. It contains at ConceptDraw Solution Park a rich set of stencils and professional flowchart symbols for design. It lets create simply professional-looking Flowcharts based on thousand free flowchart templates, colored symbols and examples. ConceptDraw DIAGRAM is a 3 times cheaper alternative to MS Visio available for both Mac and PC. It’s is another full featured business and technical diagramming application that can easily take care of Visio files within OS X. Another bonus with ConceptDraw DIAGRAM – it's cross-platform. You can work on a document in both OS X and Windows, skipping Visio entirely.
Entity-Relationship Diagram (ERD) with ConceptDraw DIAGRAM
Entity-Relationship Diagram (ERD) is applied for detailed description of structures and high-level (conceptual) design databases using the Chen's and Crow's Foot notations. An ERD represents a diagram constructed mainly of rectangular blocks (for entities, data) linked with relationships. The links between the blocks are used to describe relations between the entities. There are three types of relationships: one-to-one, one-to-many, and many-to-many. Use the specialized ERD software - ConceptDraw DIAGRAM to create the Entity-Relationship Diagrams (ERDs) of any degree of complexity with Chen's and Crow's Foot notations. Draw them easily applying the powerful built-in tools and libraries of predesigned ERD vector objects from Entity-Relationship Diagram (ERD) solution from the Software Development area of ConceptDraw Solution Park. You can also start with one of ready template or sample included to this solution. Designing the ERDs in ConceptDraw DIAGRAM you can easy move the objects within a diagram with saving the relationships between them.
- How to Draw an Organization Chart | How to Draw an ...
- How to Draw an Organization Chart | Organizational Charts with ...
- University Organizational Chart Sample
- Organizational chart - University leadership | Organizational ...
- Organizational chart - University leadership | SWOT analysis for a ...
- How to Draw an Organization Chart | Organizational Charts with ...
- Orgchart | How to Draw an Organization Chart | Business Diagram ...
- Organizational Structure | How to Draw an Organization Chart ...
- Examples of Flowcharts, Org Charts and More | Example of ...
- How to Draw an Organization Chart | Organizational Structure ...
- How to Draw an Organization Chart | Organogram Software ...
- University Drawing
- Leadership and data - Circle-spoke diagram | Organizational chart ...
- How to Draw an Organization Chart | How to Draw an ...
- Examples of Flowcharts, Org Charts and More | Matrix Organization ...
- Coad/Yourdon's Object-Oriented Analysis model | Organizational ...
- Examples of Flowcharts, Org Charts and More | Process Flowchart ...
- Geo Map - USA - Ohio | Organizational chart - University leadership ...
- Example of Organizational Chart | Organizational Structure ...
- Organizational Chart Symbols


