HelpDesk
How to Create a Picture Graph
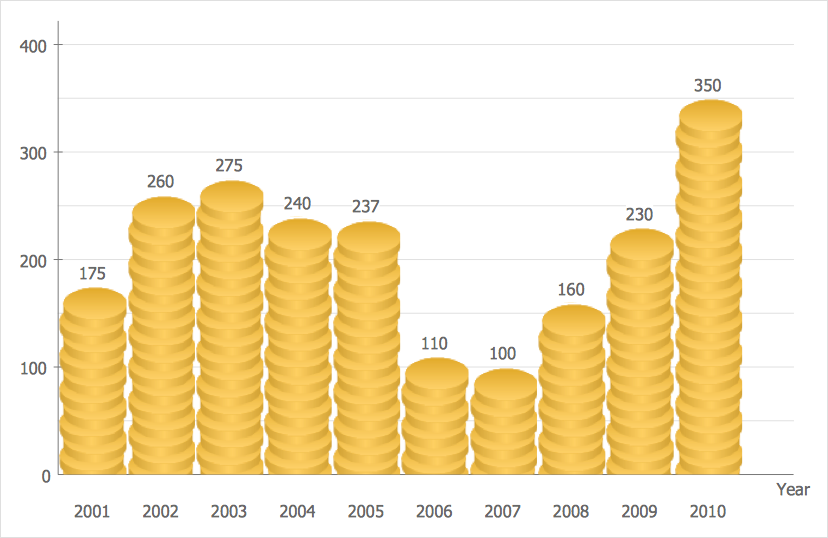
Picture Graphs are used commonly to represent non-complex data to a large audience. A Picture Graph is a simple kind of marketing diagram used to show the relationship among various quantities. It includes pictures or symbols to represent information visually. There are many cases when you have just some numbers to show and compare. This is not a reason to not use visual tools. You can produce a simple picture graph using memorable symbols to get the best visual presentation. Using specific symbols instead of regular colored bars makes picture graphs a much more descriptive tool. You can use tools from an existing library or find appropriate clipart in ConceptDraw’s collection. ConceptDraw DIAGRAM allows you to draw a simple and easy to understand Picture Charts using the special library.HelpDesk
How to Get Images for Project Presentation on macOS
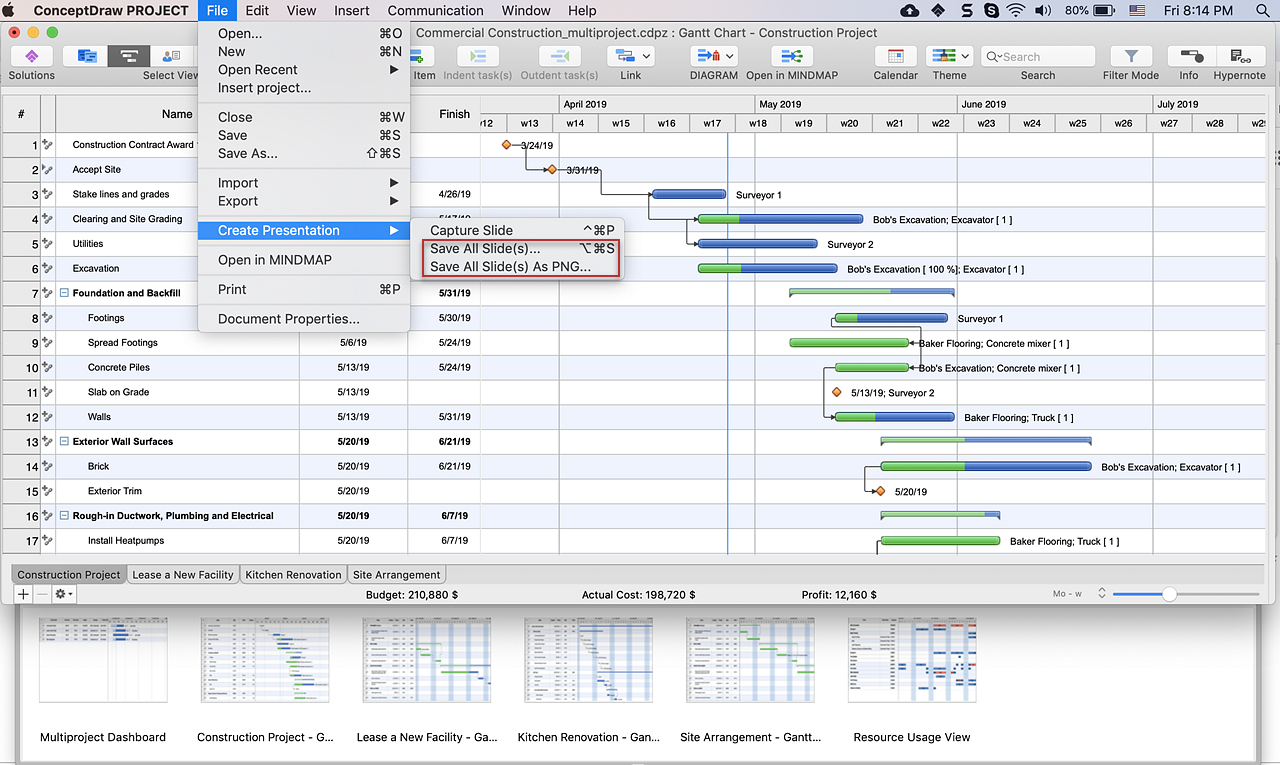
ConceptDraw PROJECT allows you to easily make slides for presentation.- Organisation Chart Template With Photo
- Photo Organizational Chart Example
- Photo Org Chart
- Organizational Chart With Pictures
- Make A Timeline Photo
- A Simple Photography Organization Chart
- Healthy Diet Plan | Healthy Diet | Food Pictures | Image Of Balance ...
- Photography Organization Chart
- Computer Picture Chart
- Photo Timeline Creator
- Photo Sample Development Process Flow Chart
- Photo Timeline Software
- Examples of Flowcharts, Org Charts and More | Pie Chart Examples ...
- Basic Flowchart Images . Flowchart Examples | Basic Flowchart ...
- Flow Chart Symbol Photo
- Organizational Structure | How to Draw an Organization Chart ...
- Matrix Organization Structure | How to Draw a Matrix Organizational ...
- Computer Drawing Pic With Chart
- Bar Graphs | Picture Graphs | Sales Growth. Bar Graphs Example ...
- Flow Chart On Mass Communication Photo

