HelpDesk
How to Create Organizational Chart Quickly
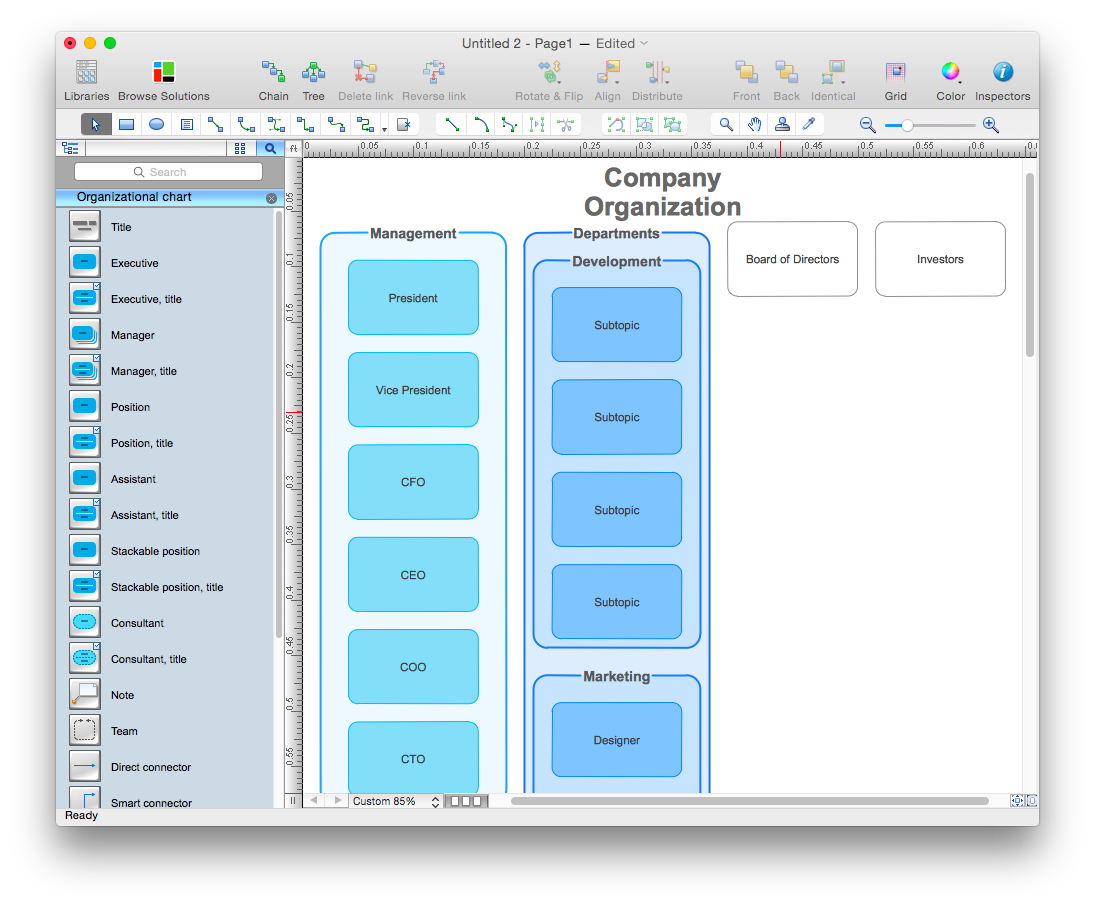
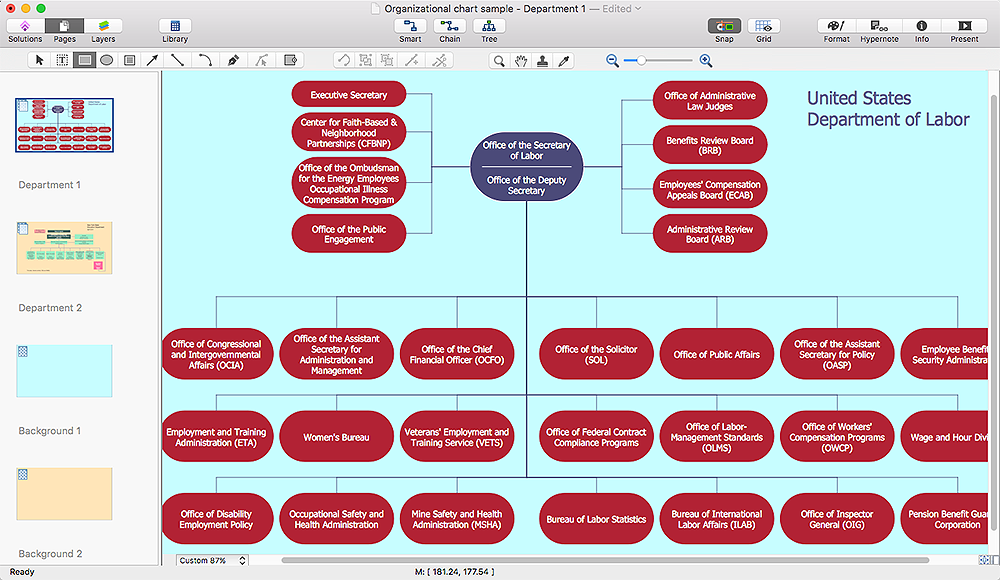
Use ConceptDraw MINDMAP for generating structured data on organization structure and then ConceptDraw PRO for presenting the results as chart.
 Organizational Charts
Organizational Charts solution extends ConceptDraw PRO software with samples, templates and library of vector stencils for drawing the org charts.
HelpDesk
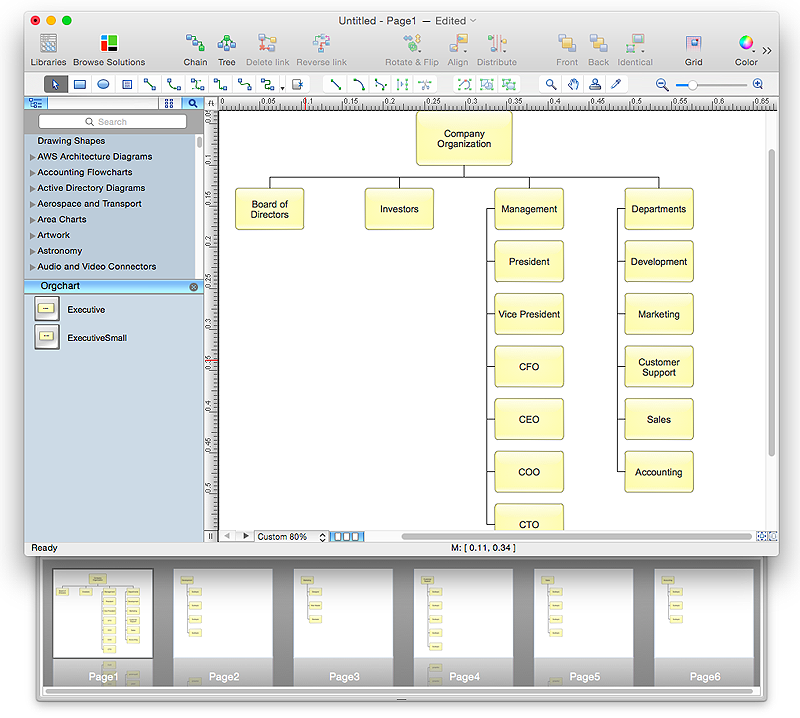
How to Draw an Organizational Chart Using ConceptDraw PRO
The organizational chart software is a valuable tool for modern business. It is important for any business to build a clear organizational structure that determines the responsibilities and relationships between different positions in the organization. The clear structured organization - means the clear structured business workflow, which is the core of success in the business. ConceptDraw PRO is an org chart software that allows you to draw an organizational structure of your company quickly and easily.HelpDesk
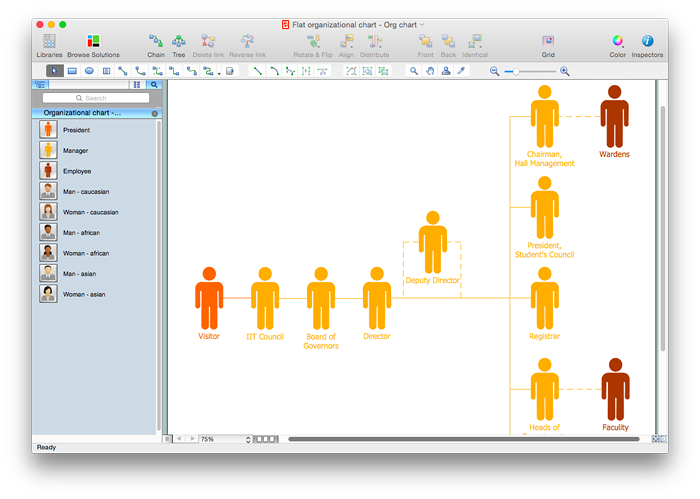
How to Draw a Flat Organizational Chart with ConceptDraw PRO
A clear organizational chart helps you to understand the relationships of positions in an organization in terms of authority and responsibility. A Flat organizational structure is one of the most typical organizational structure. Use The Flat Organizational chart template to draw an organizational structure of your company. ConceptDraw 25 Typical Orgcharts solution provides you with the possibility to develop typical organizational charts quickly and easily.HelpDesk
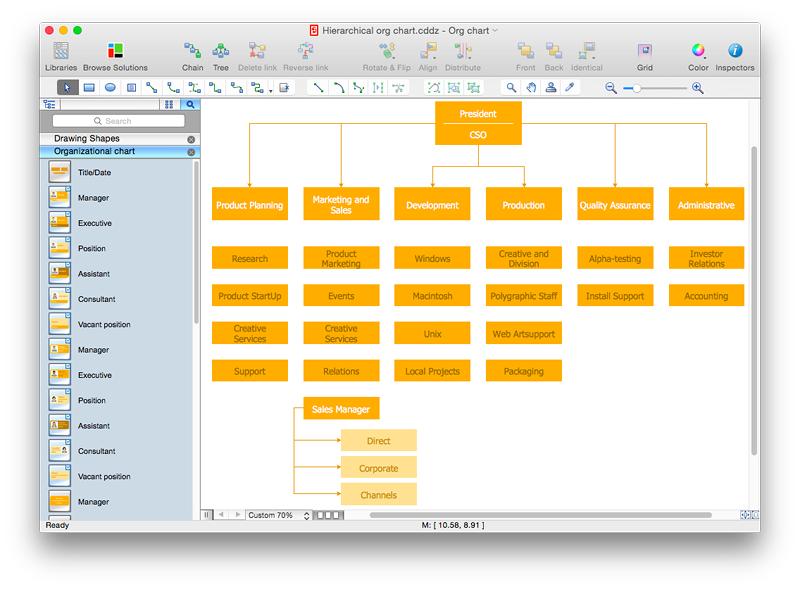
How to Draw a Hierarchical Organizational Chart with ConceptDraw PRO
There are a number of different organisational structures. The most appropriate structure will depend on the size of the business and the type of business. A hierarchical organizational structure is one of the most typical organizational structure. This structure can be represented as a pyramid, with a single entity in authority at the top, with subsequent levels of power beneath them. Each member of the pyramid reports only to their direct subordinates or superiors, limiting the amount of communication overhead, which can be seen both as an asset or a limitation. It is easy to see where a hierarchical structure would be an effective solution; companies that have offices based in disparate locations, a business that focuses on diversified markets, any organization with need for multiple levels of middle management. You can easily create a clear hierarchical organizational chart using ConceptDraw solution that contains templates of the 25 Typical Orgcharts.HelpDesk
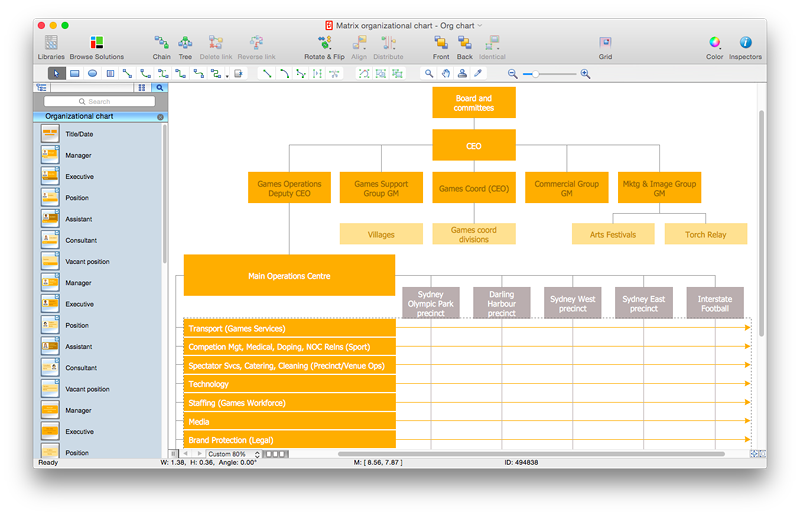
How to Draw a Matrix Organizational Chart with ConceptDraw PRO
There are a number of moments which are influenced on how the organizational structure of a certain business needs to be, how complex, and which type it should keep. The matrix organizational structure is atypical because it brings together employees and managers from different departments to work toward accomplishing a goal. This structure is commonly found in businesses that have more than one line of reportage. For instance, a company might contain an engineering department with engineering managers who workers report to. However, these workers might also have to liaise with different product or project managers depending on current tasks. Some form of matrix organization is found in most large-scale modern businesses. It is one of the most complicated reporting structures. You can easily build a clear matrix organizational chart in ConceptDraw PRO using templates from ConceptDraw Solution Park.
 25 Typical Orgcharts
The 25 Typical Orgcharts solution contains powerful organizational structure and organizational management drawing tools, a variety of professionally designed organization chart and matrix organization structure samples, 25 templates based on various orga
Organizational Charts with ConceptDraw PRO
Organizational chart or Orgchart is a diagram that depicts the structure of an organization using the terms of work responsibility and rank position. It is a useful and convenient format to visually illustrate the relationships within an organization, which is moreover applicable for organization of any size. Typically, an Organizational chart is constructed from the rectangular object blocks, which represent a job title, a person's name and relationships associated with them. You looks for the powerful Orgchart software? ConceptDraw PRO software is exactly what you've been searching long. Extended with Organizational Charts Solution, ConceptDraw PRO offers great-looking examples and samples of Orgcharts, built-in templates and various types of predesigned vector block objects and connectors for creation all kinds of Organizational Charts - from simple to complex multi-page. When designing the chart for large organization with complex branched structure, may be convenient to divide it into few smaller charts.HelpDesk
How to Create Organizational Chart Using Management Solution
Use ConceptDraw MINDMAP for generating structured data on organization structure and then ConceptDraw PRO for presenting the results as chart.
 Cafe and Restaurant Floor Plans
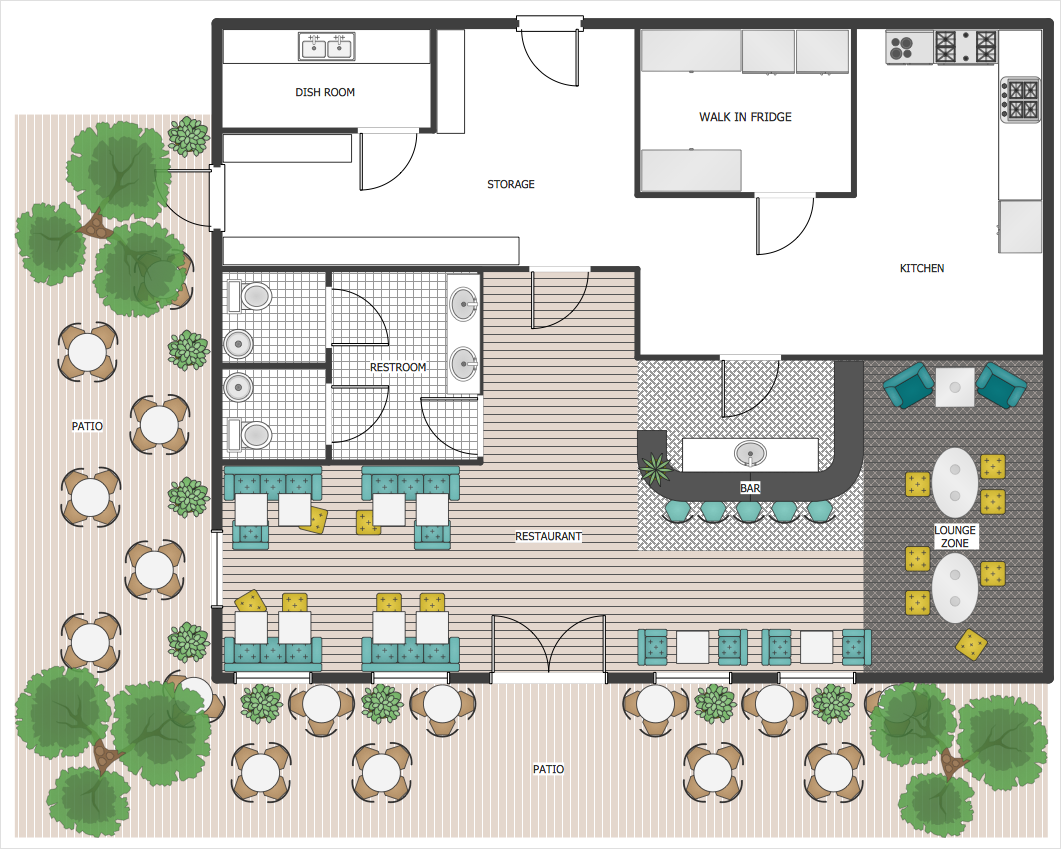
Restaurants and cafes are popular places for recreation, relaxation, and are the scene for many impressions and memories, so their construction and design requires special attention. Restaurants must to be projected and constructed to be comfortable and e
HelpDesk
Restaurant Floor Plan Maker
Someone might think that creating a plan of cafe or restaurant is quite simple. But in fact it is a real art. You need to make it not only beautiful, but also convenient for visitors. Today, restaurants and cafes are not only the places, where people eat, but a places for business meetings, and recreation. Therefore, a well-designed project of the restaurant (cafe, bar) leads to successful sales and good incomes. The ConceptDraw Cafe and Restaurant Floor Plan solution includes libraries that are tailored for Cafe and Restaurants floor plans and interiors.Flow chart Example. Warehouse Flowchart
Warehouse Flowcharts are various diagrams that describe the warehousing and inventory management processes on the warehouses. Typical purposes of Warehouse Flowcharts are evaluating warehouse performance, measuring efficiency of customer service and organizational performance. This type of Workflow diagrams can be used for identifying any disconnection between business activities and business objectives. They are effectively used by warehouse-related people and organizations, manufacturers, wholesalers, exporters, importers, transporters, and others. Standard Warehousing process flow diagram and standard Workflow diagram are used for process identification for further evaluating effectiveness and profitability of overall business process. Use the ConceptDraw PRO vector graphic software extended with Flowcharts solution to design your own professional-looking Workflow diagrams and Flowcharts of any types, including the Warehouse flowchart, Process flow diagrams which depict in details all steps of Warehouse packages flow. Microsoft Visio, designed for Windows users, can’t be opened directly on Mac. But fortunately, there are several Visio alternatives for Mac which will help Mac users to work Visio files. With ConceptDraw PRO, you may open, edit and save files in Visio format.
HelpDesk
How To Create a PERT Chart
Project Evaluation and Review Technique (PERT) is a method of project tasks evaluation and analysis. PERT - is a method of analyzing the tasks required to complete the project. It includes analysis of the time required to complete each task, as well as the determination of the time required to carry out the whole project. PERT was developed to facilitate the planning of huge and complex projects. PERT is used for very large, complex, and non-standard projects. Technology implies the presence of uncertainty, making it possible to develop a schedule of the project without a precise information on details and time required for all of its components. The most popular part of PERT is a method of the critical path, based on the construction of the network schedule (PERT network diagram). ConceptDraw Office delivers you the best way to create PERT chart for your project using compatibility between ConceptDraw PROJECT and ConceptDraw PRO.
 ConceptDraw Solution Park
ConceptDraw Solution Park collects graphic extensions, examples and learning materials
HelpDesk
How to Design a Fast-Food Restaurant Menu
Food menus are a crucial part in catering business. When designing your menu for a fast-food restaurant, you want to create a list of meals that which looks professional and attractive. Just the image of a food, will get guests a pleasant expectation. Adds use the best images to present tempting dishes. Restaurants and fast-food joints add images of their best dishes to the menu — even if what you see isn't always exactly what you get! The ConceptDraw Food Court solution provides users with collection of library objects and example drawings for ConceptDraw PRO makes short work of drawing professional visualizations related to catering business.HelpDesk
How to Create a HR Process Flowchart
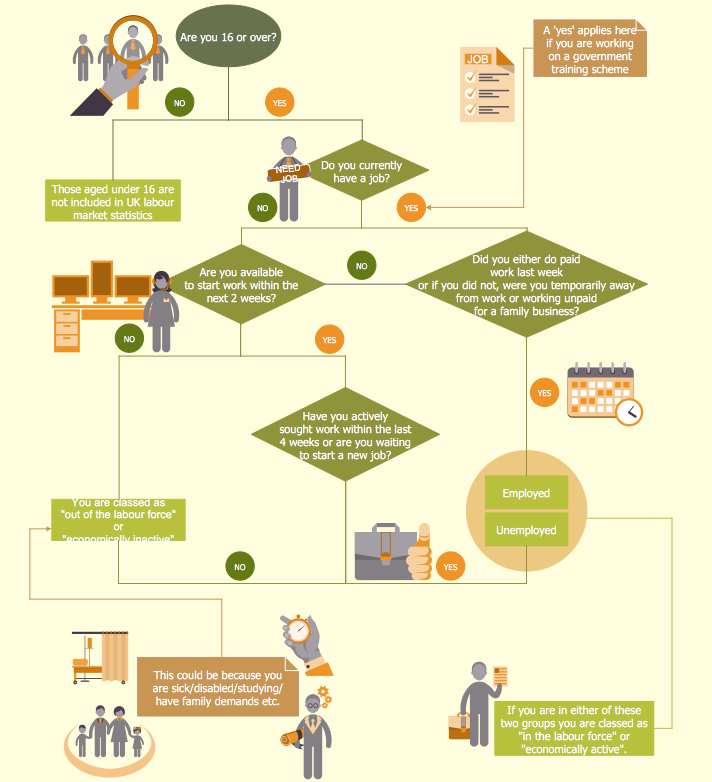
One of the useful tools of each HR specialist is a HR Process Flowchart. HR Flowchart renders step-by-step the process of Human Resource management in any organization. HR flowchart shows the flow of all HR processes, identifies and standardizes the list of mandatory documents required for the implementation of all HR procedures, including the recruiting process. Usually, the descriptions of entire HR processes in a company requires a big set of graphic documents. They must be regularly redrawn to maintain up to date. The best tool for this is ConceptDraw PRO - the best software to create process flow diagrams of various types. In conjunction with ConceptDraw HR flowchart solution, it delivers comprehensive tool-set for human resource management.HelpDesk
How to Add a Floor Plan to MS Word Document
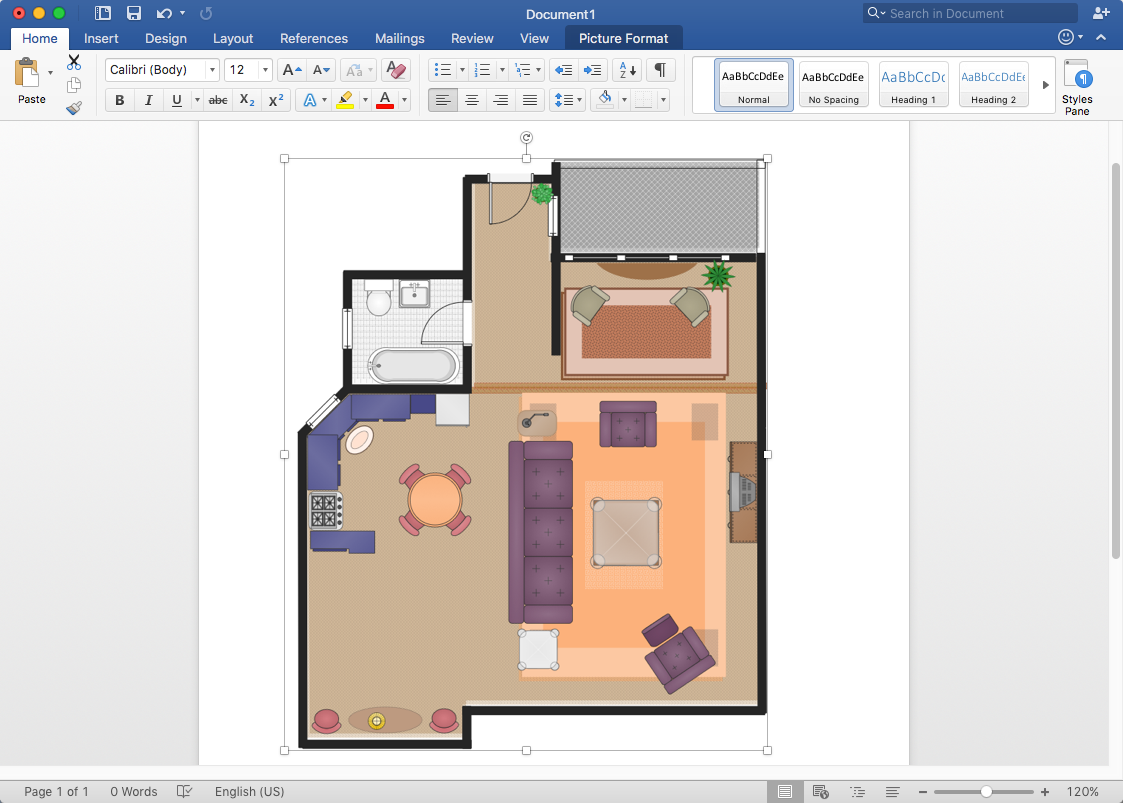
ConceptDraw PRO allows you to easily create floor plans of any complexity and then insert them into a MS Word document.HelpDesk
How to Create a Time Series Dashboard
Time Series Dashboard means an integration of some type of diagrams: Line Charts, Bar Charts, Column Charts, and Dot Plots on a single space. The ConceptDraw Time Series Dashboard solution can be used to create the interactive Time Series dashboard. The libraries of Time Series Charts solution contain the Live Objects, that can change their appearance depending on the external data. Each chart from the Time Series dashboard displays particular source data. You can include Time Series Charts in your business or technical dashboards to show and compare the items changing over time.HelpDesk
How to Make Different Backgrounds Within a Multipage Drawing
Tips on how to add different backgrounds within single ConceptDraw documentHelpDesk
How to Draw a Line Chart Quickly
A common line chart is a graphical representation of the functional relationship between two series of data. A line chart that is created by connecting a series of data points together with a straight line is the most basic type of a line chart. A line chart can be used for depicting data that changes continuously over time. It is extensively utilized in statistics, marketing and financial business. ConceptDraw Line Graph solution provides the possibility to make 2D line charts quickly and effortlessly.- Organizational Chart Template
- Restaurant Organizational Chart Samples
- Organizational Charts | Cafe and Restaurant Floor Plan | 25 Typical ...
- How to Create Organizational Chart Quickly | Organizational Charts ...
- Restaurant Organizational Chart
- Restaurant Organizational Chart Sample
- How to Create Organizational Chart Quickly | Organizational Charts ...
- Flow chart Example . Warehouse Flowchart | 25 Typical Orgcharts ...
- Organizational Charts | Cafe and Restaurant Floor Plan | 25 Typical ...
- How To Create Restaurant Floor Plan in Minutes | Flowchart ...
- HVAC Business Plan | Emergency Plan | Examples of Flowcharts ...
- How to Draw an Organization Chart | Organizational Structure ...
- Organizational Chart Template
- Flow chart Example . Warehouse Flowchart | 25 Typical Orgcharts ...
- Sample Matrix Diagram Explanation Of A Food Restaurant
- Seven Management and Planning Tools | Examples of Flowcharts ...
- How to Create a Timeline Diagram in ConceptDraw PRO | Cafe and ...
- Organisation Chart For Restaurant Manager
- How To Create Restaurant Floor Plan in Minutes | Business Board ...
- Flow chart Example . Warehouse Flowchart | 25 Typical Orgcharts ...
