The vector stencils library "Management pictograms" contains 72 management pictograms.
Use it to create your management infogram in the ConceptDraw PRO diagramming and vector drawing software.
The flat icons example "Management pictograms - Vector stencils library" is included in the solution "Marketing infographics" from the "Business infographics" area of ConceptDraw Solution Park.
Use it to create your management infogram in the ConceptDraw PRO diagramming and vector drawing software.
The flat icons example "Management pictograms - Vector stencils library" is included in the solution "Marketing infographics" from the "Business infographics" area of ConceptDraw Solution Park.
Accounting management

Activity

Audit management

Board of directors

Budget

Business managemen

Business management tools

Business model

Commanding

Communication

Company

Contract management

Controlling

Coordinating

Core competencies

Corporate strategy

Creativity

Crisis management

Crisis management 2

Decision making

Environmental management

Expenses

External environment

Financial management

Financial management 2

Financial planning

First-level manager

Goal

HR management

Investment management

IT management

Knowledge management

Knowledge management 2

Leadership

Macro environment

Management system

Managerial accounting

Manufacturing management

Market orientation

Marketing management

Marketing strategy

Middle-level manager

Mission

Objectives

Operations management

Organizing

Performance

Performance management

Planning

Policy

PR management

Problem solving

Process management

Product management

Profit

Profit 2

Project management

Quality management

Research and development

Resource management

Resources

Risk management

Sales manegment

Service management

Stakeholder management

Strategic management

Strategic planning

Technology management

Time frame

Time management

Top-level manager

Vision

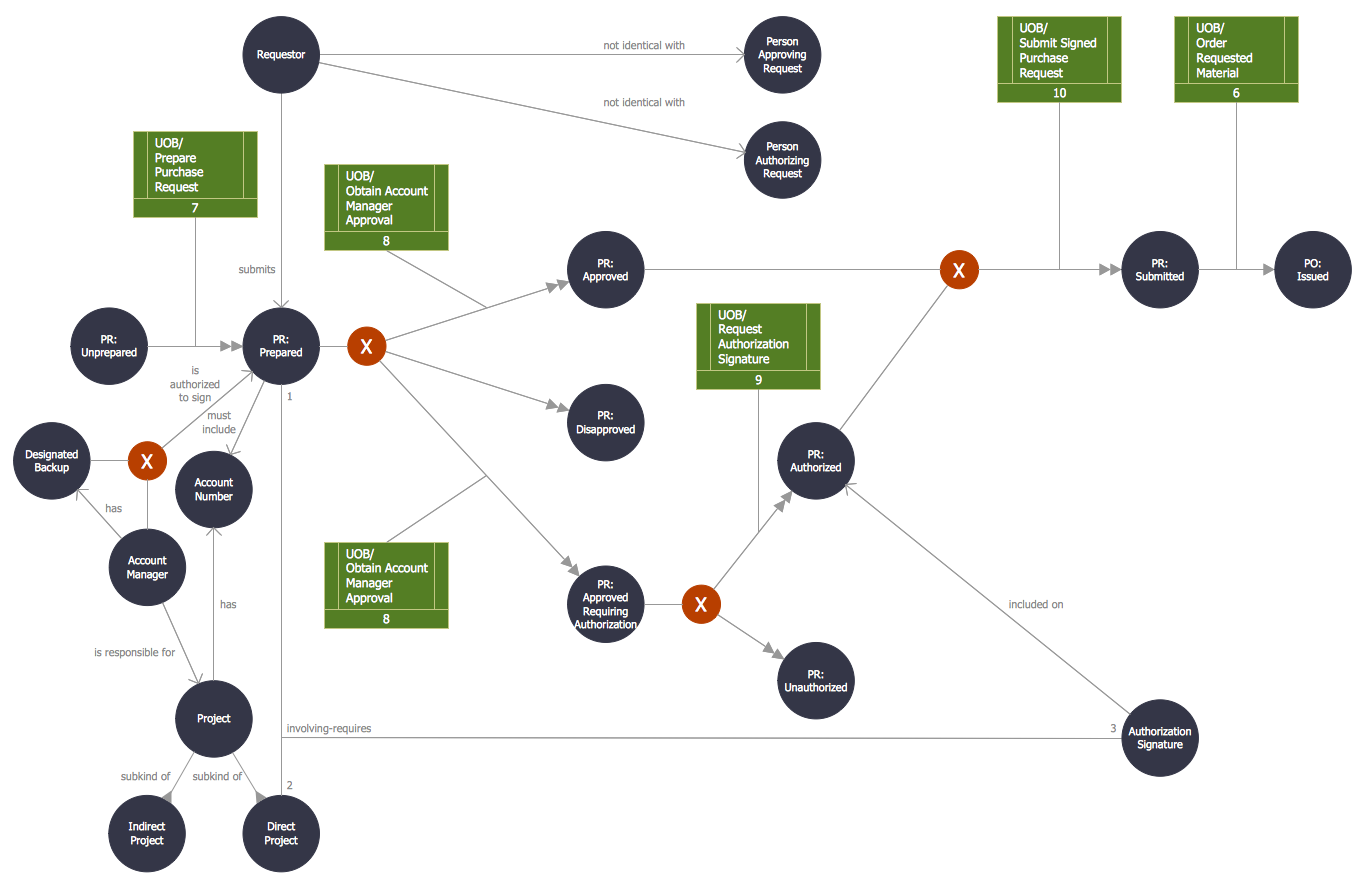
Object-Oriented Design
The vector stencils library "Management pictograms" contains 72 management pictograms.
Use it to create your management infogram in the ConceptDraw PRO diagramming and vector drawing software.
The flat icons example "Management pictograms - Vector stencils library" is included in the solution "Marketing infographics" from the "Business infographics" area of ConceptDraw Solution Park.
Use it to create your management infogram in the ConceptDraw PRO diagramming and vector drawing software.
The flat icons example "Management pictograms - Vector stencils library" is included in the solution "Marketing infographics" from the "Business infographics" area of ConceptDraw Solution Park.
Accounting management
Activity
Audit management
Board of directors
Budget
Business managemen
Business management tools
Business model
Commanding
Communication
Company
Contract management
Controlling
Coordinating
Core competencies
Corporate strategy
Creativity
Crisis management
Crisis management 2
Decision making
Environmental management
Expenses
External environment
Financial management
Financial management 2
Financial planning
First-level manager
Goal
HR management
Investment management
IT management
Knowledge management
Knowledge management 2
Leadership
Macro environment
Management system
Managerial accounting
Manufacturing management
Market orientation
Marketing management
Marketing strategy
Middle-level manager
Mission
Objectives
Operations management
Organizing
Performance
Performance management
Planning
Policy
PR management
Problem solving
Process management
Product management
Profit
Profit 2
Project management
Quality management
Research and development
Resource management
Resources
Risk management
Sales manegment
Service management
Stakeholder management
Strategic management
Strategic planning
Technology management
Time frame
Time management
Top-level manager
Vision
UML Class Diagram Generalization Example UML Diagrams

How to Construct a Fishbone Diagram

Examples for OOSE Method
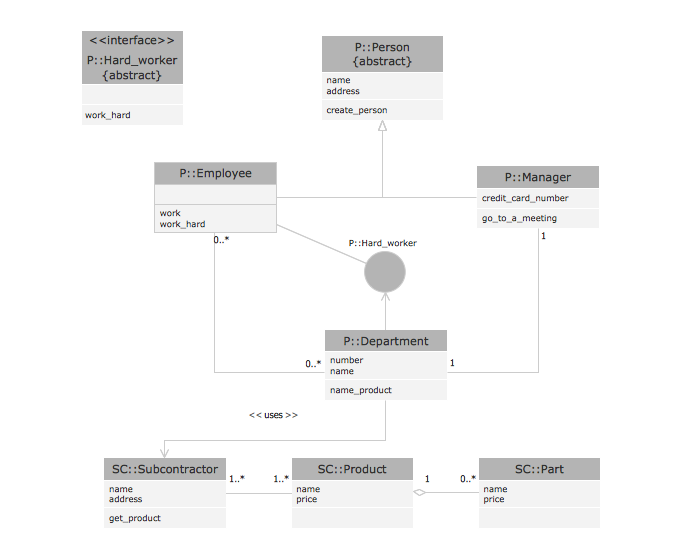
OMT Method
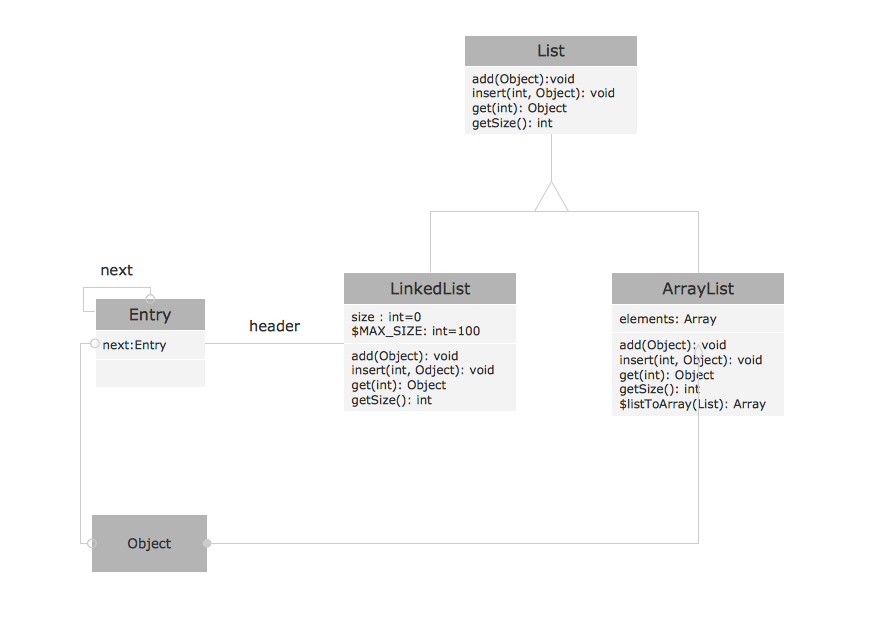
UML Class Diagram Notation

Mechanical Drawing Symbols

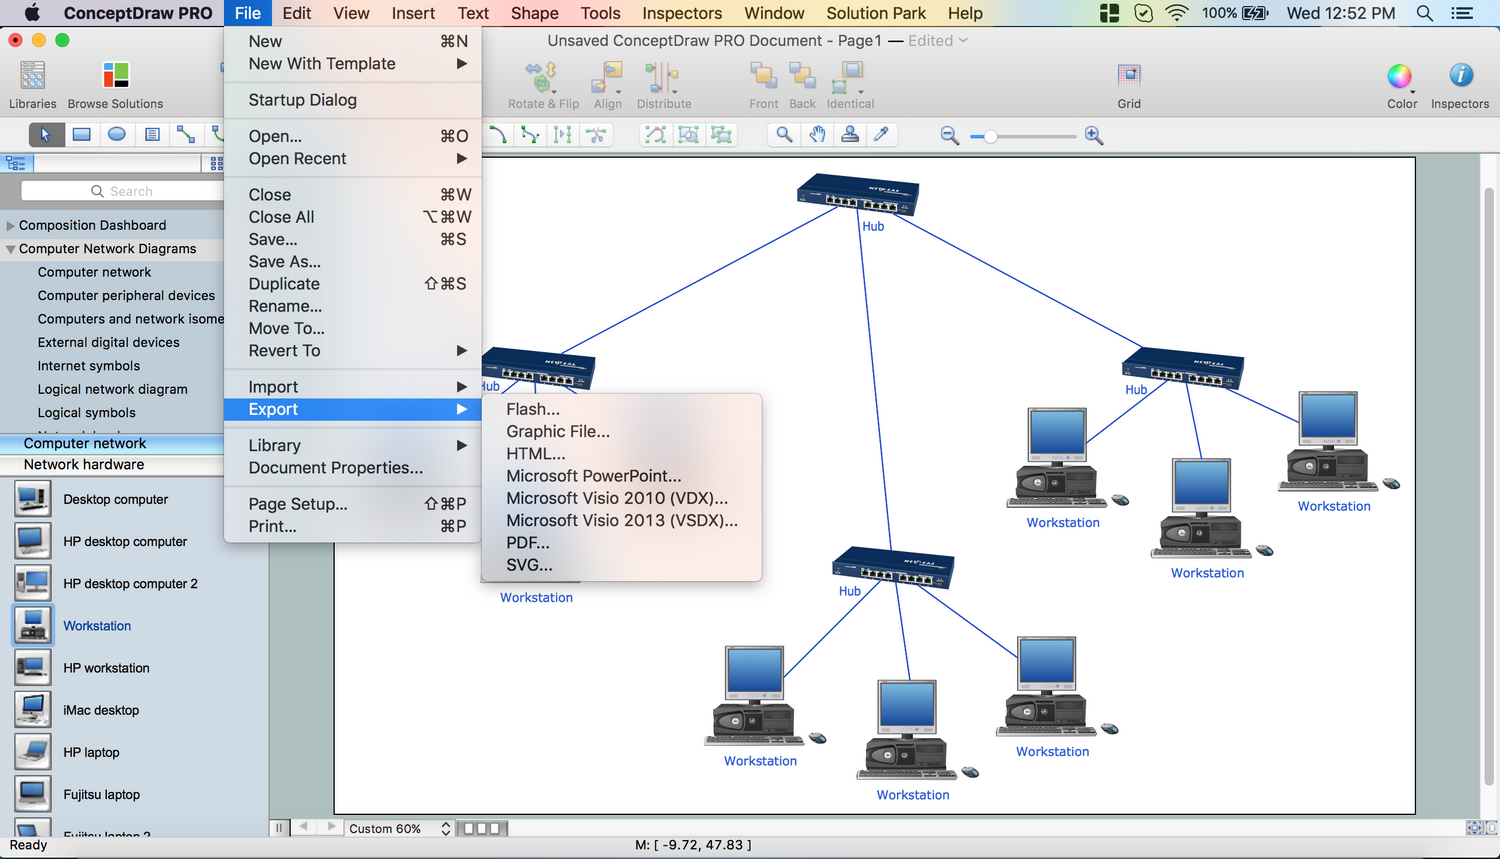
Network Topology Mapper
- Management pictograms - Vector stencils library
- How to Create a Scatter Chart | North Orientation Symbol
- Market Management Orientation Pyramid
- Door Orientation Symbol Architecture
- Technician Orientation Flow
- Management pictograms - Vector stencils library | Management ...
- Flow Direction Symbols
- Management - Design Elements | Management pictograms - Vector ...
- Management pictograms - Vector stencils library | Marketing ...
- Check Valve Symbol Flow Direction