HelpDesk
How to Draw a Pareto Chart
The Seven Basic Tools of Quality were picked as effective visual tool-set for identifying the root cause of quality-related problems within the workplace. Seven Basic Tools of Quality comprise of seven diagrams that are diverse enough to be used to any business troubleshooting scenario, but simple enough that employees of all types can understand and apply them. One of these tools is a Pareto chart. It combines both a line graph and a bar chart, where the bar chart displays data values, and a line represents a total value. Pareto chart is used for quality control to identify the source of the quality problem. ConceptDraw Seven Basic Tools of Quality solution delivers a big set of vector stencil libraries and samples for each quality control diagram, including a Pareto chart.Pareto Chart
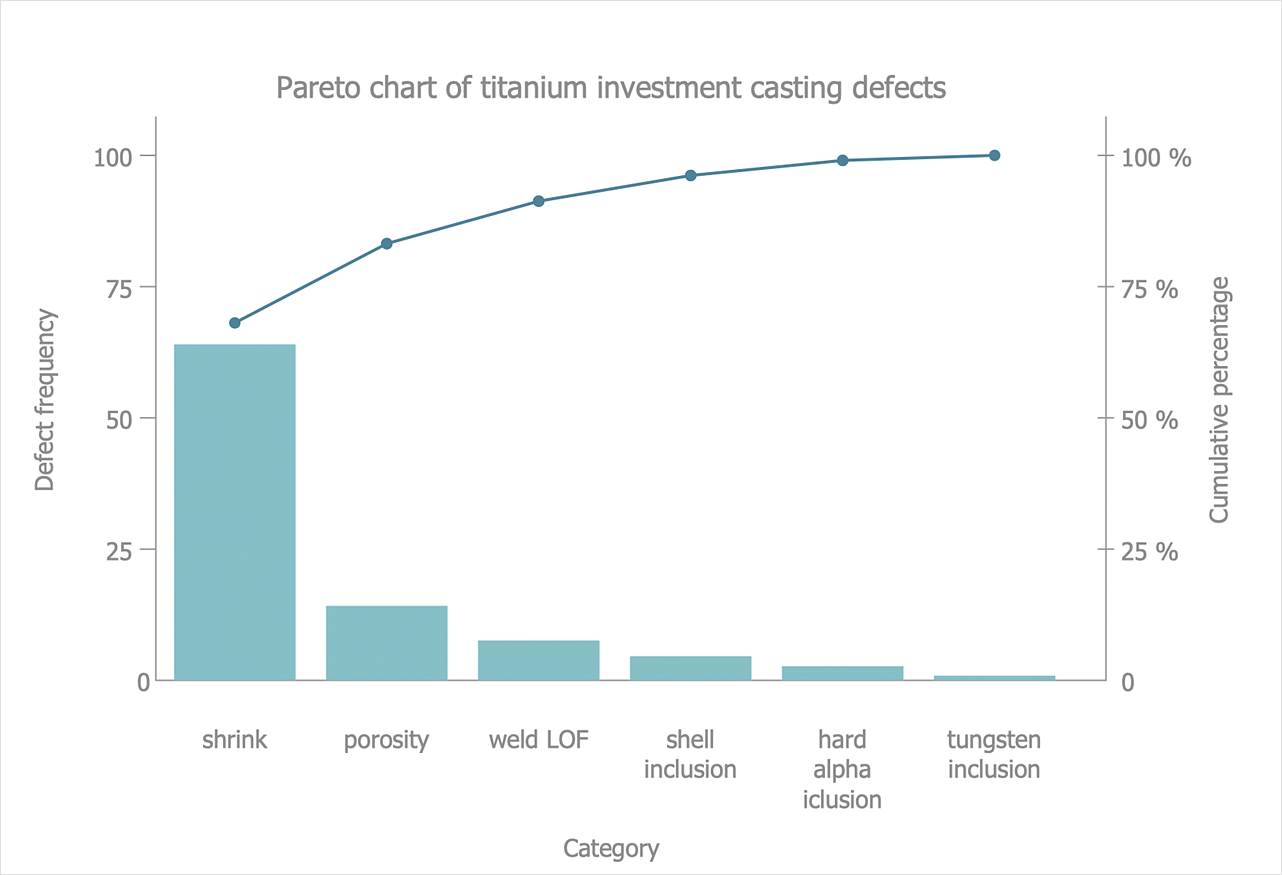
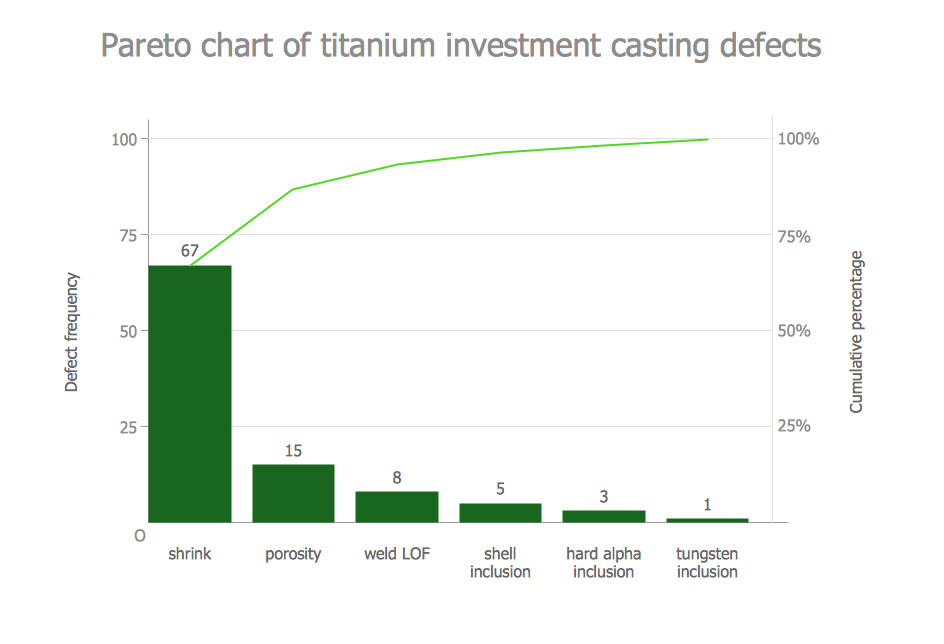
This sample shows the Pareto Chart of titanium investment casting defects. On the Pareto chart at the same time are displayed a bar graph and a line graph. The descending values are represented by the bars and the cumulative total values are represented by the line. Pareto charts are widely used in the areas of the quality improvement and the time management.Seven Basic Tools of Quality - Pareto Chart
Pareto Chart design is now easier than ever thanks to the ConceptDraw DIAGRAM software and powerful drawing tools, 9 libraries with numerous vector objects, collection of professionally designed and well thought-out samples offered by Seven Basic Tools of Quality solution from the Quality area of ConceptDraw Solution Park.Pareto Chart
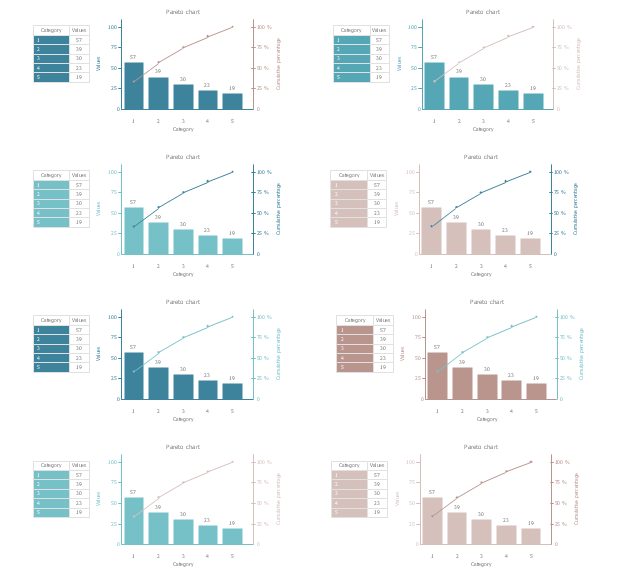
This sample shows the Pareto Chart. It was created in ConceptDraw DIAGRAM diagramming and vector drawing software using the Basic Diagramming Solution from the Universal Diagramming area of ConceptDraw Solution Park.The vector stencils library "Pareto chart" contains 8 Pareto chart templates.
Use it to design your Pareto charts with ConceptDraw PRO diagramming and vector drawing software.
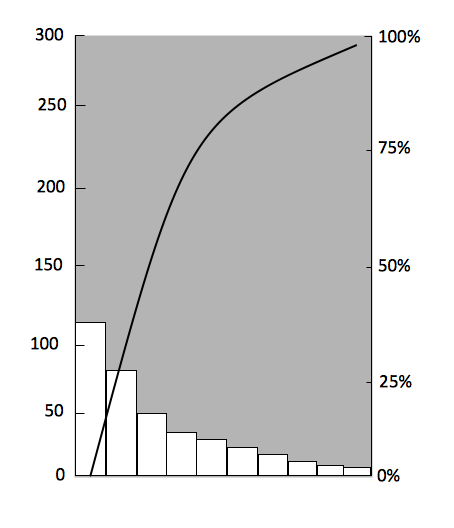
"A Pareto chart, named after Vilfredo Pareto, is a type of chart that contains both bars and a line graph, where individual values are represented in descending order by bars, and the cumulative total is represented by the line. ...
The Pareto chart is one of the seven basic tools of quality control." [Pareto chart. Wikipedia]
The example of diagram templates "Design elements - Pareto chart" is included in the Seven Basic Tools of Quality solution from the Quality area of ConceptDraw Solution Park.
 Seven Basic Tools of Quality
Manage quality control in the workplace, using fishbone diagrams, flowcharts, Pareto charts and histograms, provided by the Seven Basic Tools of Quality solution.
Total Quality Management with ConceptDraw
Total Quality Management (TQM) system is the management method where the confidence in quality of all organization processes is placed foremost. The given method is widely used in production, in educational system, in government organizations and so on.Column Chart Template
Column chart templates from ConceptDraw collection can help you find the best visual depiction for you data. You can easily modify column chart templates according to data you want to visualize.Seven Basic Tools of Quality — Quality Control
ConceptDraw DIAGRAM diagramming and vector drawing software extended with Seven Basic Tools of Quality solution from the Quality area of ConceptDraw Solution Park provides effective tools for quality control and helps design any types of quality-related diagrams.Seven Basic Tools of Quality - Fishbone Diagram
ConceptDraw DIAGRAM enhanced with Seven Basic Tools of Quality solution from the Quality area of ConceptDraw Solution Park is an ideal software for fast and easy drawing professional looking quality diagrams, including a Fishbone diagram.- Pareto Chart Online Generator
- Pareto Chart Maker Online
- How to Draw a Pareto Chart Using ConceptDraw PRO | Pareto chart ...
- Pareto chart - Titanium investment casting defects | Examples of ...
- How to Draw a Pareto Chart Using ConceptDraw PRO | Network ...
- Schedule pie chart - Daily action plan | Pareto Chart | Bar Diagrams ...
- How to Draw a Pareto Chart | Seven Basic Tools of Quality - Pareto ...
- Mechanical Drawing Symbols | Pareto Chart | UML Use Case ...
- Sample Of Pareto Chart In Food And Beverage
- Design elements - Process flowchart | How to Draw a Pareto Chart ...


