 Bubble Diagrams
Bubble diagrams have enjoyed great success in software engineering, architecture, economics, medicine, landscape design, scientific and educational process, for ideas organization during brainstorming, for making business illustrations, presentations, planning, design, and strategy development. They are popular because of their simplicity and their powerful visual communication attributes.
Bubble diagrams with ConceptDraw PRO
Using ConceptDraw you will be able to create bubble diagrams from the ready ConceptDraw library objects or make your own objects. The created diagram can be saved and edited, objects can be moved and links between them will be automatically repainted after object moving because of using the ConceptDraw connectors.
 ConceptDraw Solution Park
ConceptDraw Solution Park collects graphic extensions, examples and learning materials
 Office Layout Plans
Office layouts and office plans are a special category of building plans and are often an obligatory requirement for precise and correct construction, design and exploitation office premises and business buildings. Designers and architects strive to make office plans and office floor plans simple and accurate, but at the same time unique, elegant, creative, and even extraordinary to easily increase the effectiveness of the work while attracting a large number of clients.
Building Drawing Software for Design Site Plan
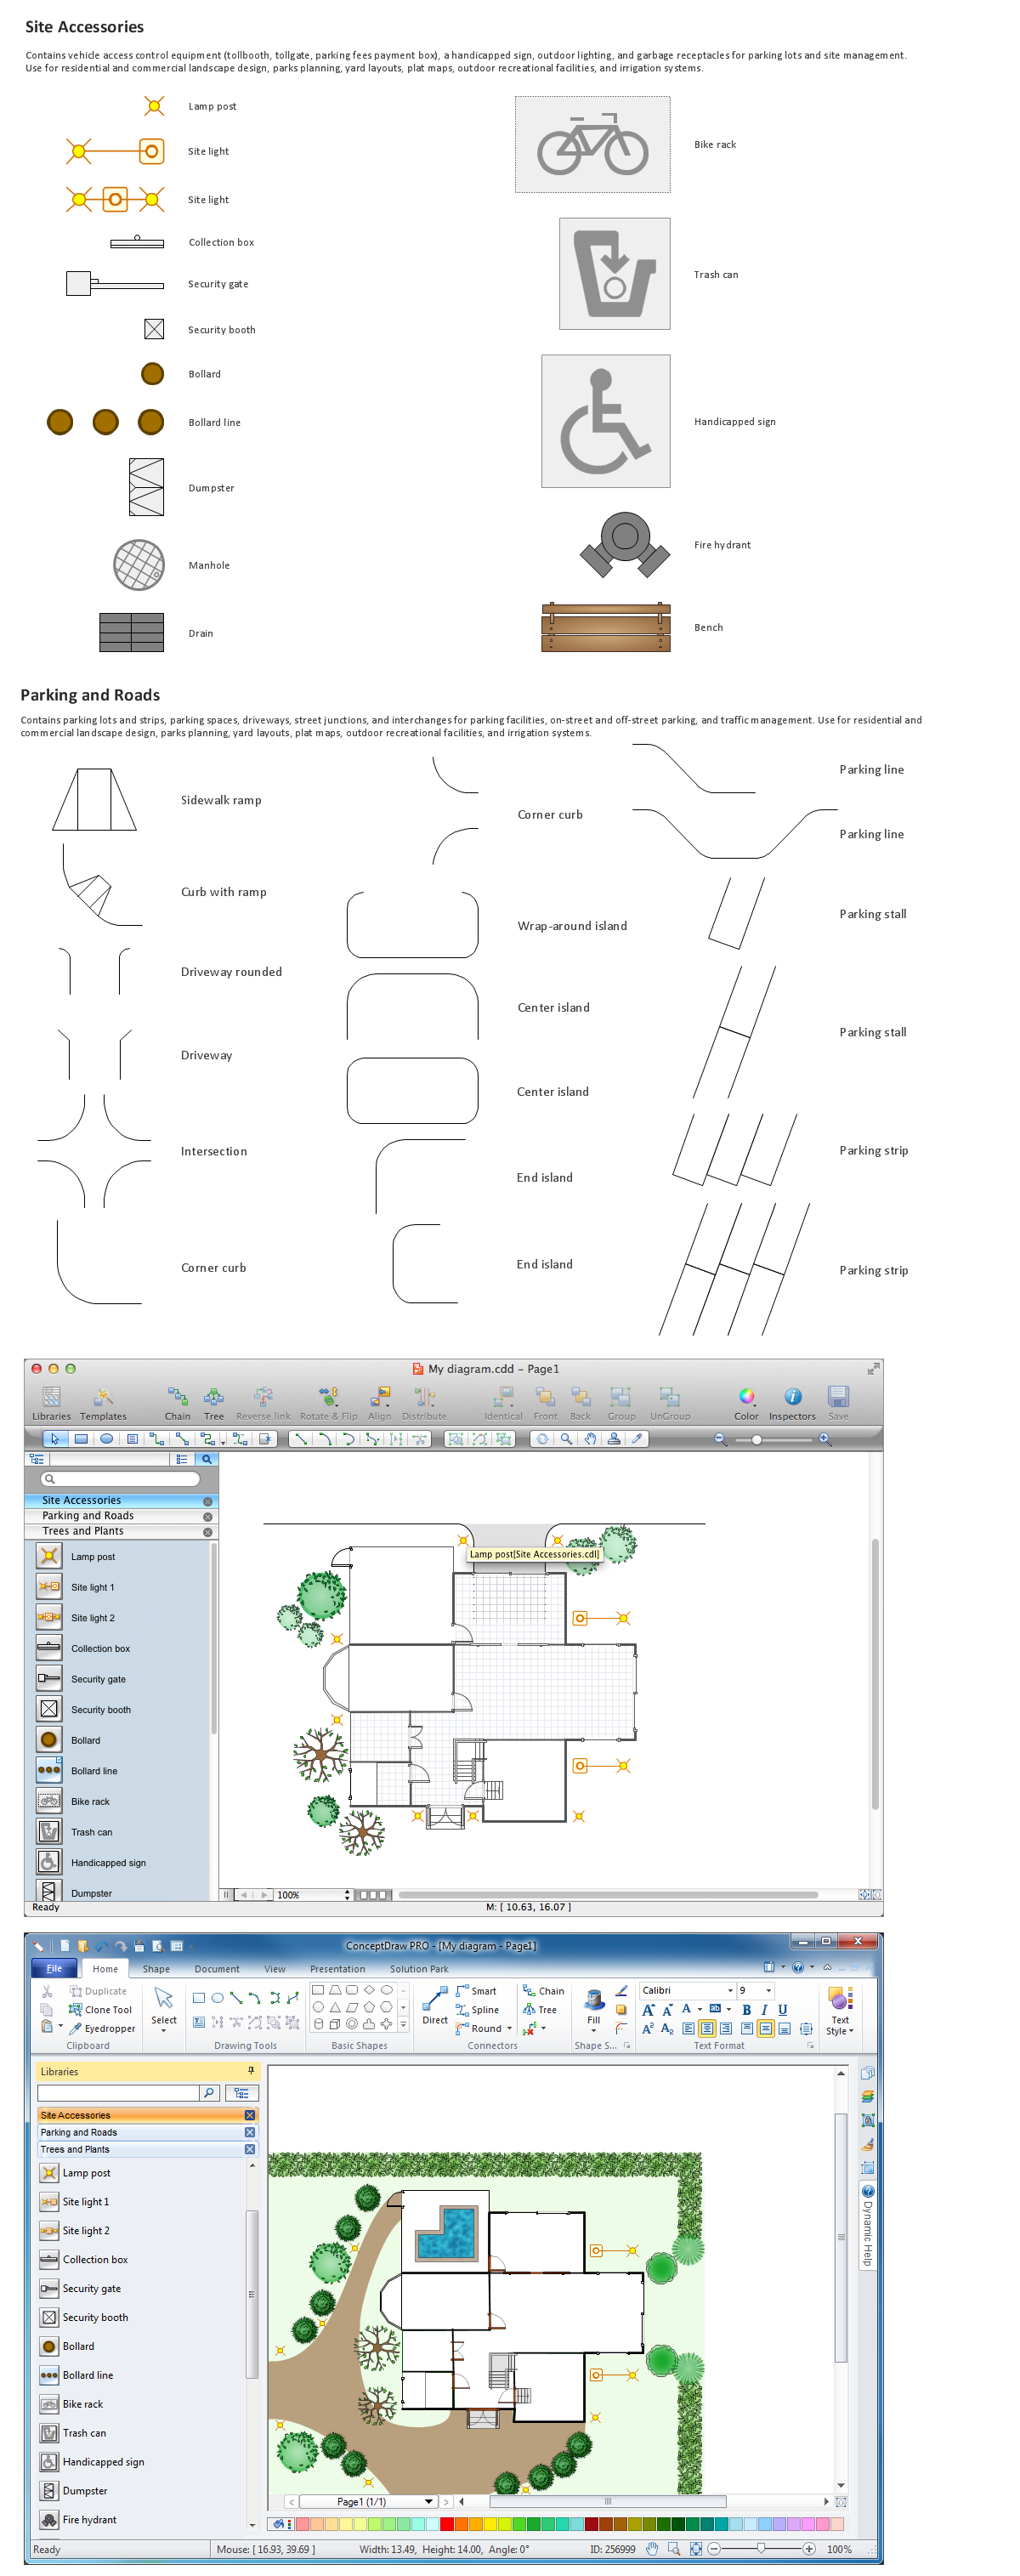
Site plan is a detailed architectural plan or document, landscape architecture project for considered object. It is a part of technical design documentation that illustrates the arrangement of buildings, trails, roads, parking, lighting, water lines, sanitary sewer lines, drainage facilities, landscape and garden elements. Site plans are constructed by architects, landscape designers or licensed design engineers, and used by the builders, contractors and installers when constructing or making improvements to some property. They reflect the main design ideas and give an instantly vision of future result after the plan's implementation. They have special value for the large projects of single or multi-floor buildings, and for accomplishment the whole districts. ConceptDraw PRO extended with Site Plans solution offers the powerful building drawing software tools and vector design elements for development and drawing Site plans and Landscape design drawings, Residential and Commercial landscape designs, Parks and Landscaping territories plans, Yard layouts, etc.
Bubble Chart
How to design a Bubble Chart? It’s very easy! All that you need is a powerful software. Never before creation of a Bubble Chart wasn’t so easy as now with tools of Bubble Diagrams Solution from the "Diagrams" Area for ConceptDraw Solution Park.Diagramming Software for Design UML Collaboration Diagrams
ConceptDraw helps you to start designing your own UML Collaboration Diagrams with examples and templates.
 Event-driven Process Chain Diagrams
Event-driven Process Chain (EPC) Diagram is a type of flowchart widely used for modeling in business engineering and reengineering, business process improvement, and analysis. EPC method was developed within the Architecture of Integrated Information Systems (ARIS) framework.
 Fishbone Diagram
Fishbone Diagrams solution extends ConceptDraw PRO software with templates, samples and library of vector stencils for drawing the Ishikawa diagrams for cause and effect analysis.
Process Flowchart
The main reason of using Process Flowchart or PFD is to show relations between major parts of the system. Process Flowcharts are used in process engineering and chemical industry where there is a requirement of depicting relationships between major components only and not include minor parts. Process Flowcharts for single unit or multiple units differ in their structure and implementation. ConceptDraw PRO is Professional business process mapping software for making Process flowcharts, Process flow diagram, Workflow diagram, flowcharts and technical illustrations for business documents and also comprehensive visio for mac application. Easier define and document basic work and data flows, financial, production and quality management processes to increase efficiency of your business with ConcepDraw PRO. Business process mapping software with Flowchart Maker ConceptDraw PRO includes extensive drawing tools, rich examples and templates, process flowchart symbols and shape libraries, smart connectors that allow you create the flowcharts of complex processes, process flow diagrams, procedures and information exchange. Process Flowchart Solution is project management workflow tools which is part ConceptDraw Project marketing project management software. Drawing charts, diagrams, and network layouts has long been the monopoly of Microsoft Visio, making Mac users to struggle when needing such visio alternative like visio for mac, it requires only to view features, make a minor edit to, or print a diagram or chart. Thankfully to MS Visio alternative like ConceptDraw PRO software, this is cross-platform charting and business process management tool, now visio alternative for making sort of visio diagram is not a problem anymore however many people still name it business process visio tools.
Chore charts with ConceptDraw PRO
Chore chart. Draw perfect-looking chore chart. Free chore chart samples. All about chore charts.Interior Design Site Plan - Design Elements
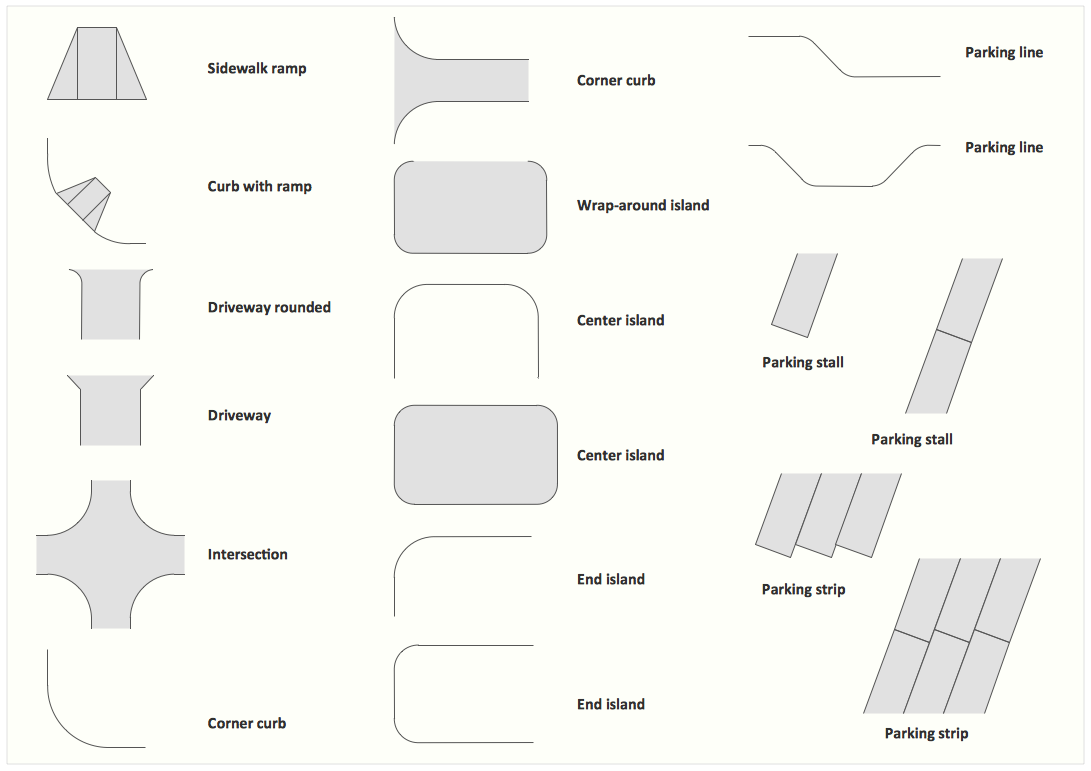
Site plans are large scale drawings that illustrate a lot of useful information, such as location of buildings on the surrounding territories, topography of the site, roads, footpaths, paved and hardstandings areas, ramps, parking areas, fencing, walls and gates, landscape elements, trees and plants, layout of external lighting and service runs, adjoining and adjacent structures, surrounding streets, and many other details. On each Site plan are also designated the scale, dimensions, site boundaries, key materials, and other additional notes. ConceptDraw PRO diagramming and interior design software extended with Site Plans solution from Building Plans area contains Parking and Roads, Site Accessories, Trees and Plants libraries with numerous collection of ready-to-use vector design elements for drawing detailed Site plans, Site design plans, Structural site plans, Landscape drawings for any locality and of any complexity without efforts. This software will be also useful for planning the parks, creation yard layouts, development residential and commercial landscape designs.
 Pie Charts
Pie Charts are extensively used in statistics and business for explaining data and work results, in mass media for comparison (i.e. to visualize the percentage for the parts of one total), and in many other fields. The Pie Charts solution for ConceptDraw PRO v10 offers powerful drawing tools, varied templates, samples, and a library of vector stencils for simple construction and design of Pie Charts, Donut Chart, and Pie Graph Worksheets.
 Fishbone Diagrams
The Fishbone Diagrams solution extends ConceptDraw PRO v10 software with the ability to easily draw the Fishbone Diagrams (Ishikawa Diagrams) to clearly see the cause and effect analysis and also problem solving. The vector graphic diagrams produced using this solution can be used in whitepapers, presentations, datasheets, posters, and published technical material.
Bubble Chart Maker
ConceptDraw PRO diagramming and vector drawing software extended with Bubble Diagrams Solution from the "Diagrams" Area is a powerful Bubble Chart Maker.- Parking Building Bubble Diagram
- Park Design Bubble Diagram
- ConceptDraw Solution Park | Bubble Diagrams | Office Layout Plans ...
- Landscape Park Design
- Bubble diagrams in Landscape Design with ConceptDraw PRO ...
- Bubble Diagram Of Post Office
- ConceptDraw Solution Park | Bubble diagrams in Landscape ...
- Bubble diagrams in Landscape Design with ConceptDraw PRO ...
- Bubble Diagrams | Building Drawing Software for Design Site Plan ...
- Land Scape Park
- Bubble Diagram Of A Parking Lot
- Bubble diagrams in Landscape Design with ConceptDraw PRO ...
- ConceptDraw Solution Park | ConceptDraw PRO ER Diagram Tool ...
- Train Station Site Plan Bubble Diagram
- Building Drawing Software for Design Site Plan | Bubble diagrams ...
- Design elements - Bubble diagrams | Bubble Diagrams | How to Add ...
- Bubble diagrams in Landscape Design with ConceptDraw PRO ...
- Bubble diagrams in Landscape Design with ConceptDraw PRO ...
- Mind Mapping For Smart Parking
- Bubble diagrams in Landscape Design with ConceptDraw PRO ...


