Pie Chart Software

 ConceptDraw Solution Park
ConceptDraw Solution Park collects graphic extensions, examples and learning materials
 Logistics Flow Charts
Logistics Flow Charts solution extends ConceptDraw PRO v11 functionality with opportunities of powerful logistics management software. It provides large collection of predesigned vector logistic symbols, pictograms, objects and clipart to help you design with pleasure Logistics flow chart, Logistics process flow diagram, Inventory flow chart, Warehouse flowchart, Warehouse management flow chart, Inventory control flowchart, or any other Logistics diagram. Use this solution for logistics planning, to reflect logistics activities and processes of an enterprise or firm, to depict the company's supply chains, to demonstrate the ways of enhancing the economic stability on the market, to realize logistics reforms and effective products' promotion.
 Plant Layout Plans
This solution extends ConceptDraw PRO v.9.5 plant layout software (or later) with process plant layout and piping design samples, templates and libraries of vector stencils for drawing Plant Layout plans. Use it to develop plant layouts, power plant desig
 Cross-Functional Flowcharts
Cross-functional flowcharts are powerful and useful tool for visualizing and analyzing complex business processes which requires involvement of multiple people, teams or even departments. They let clearly represent a sequence of the process steps, the order of operations, relationships between processes and responsible functional units (such as departments or positions).
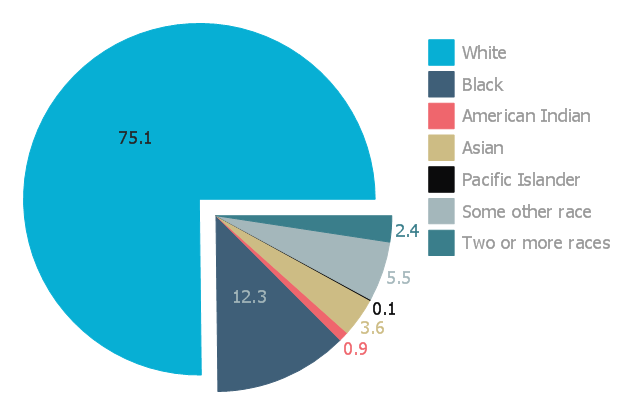
This exploded pie chart sample shows the racial make-up of the U.S. in 2000. It was designed on the base of the Wikimedia Commons file: Percentages of the us population by race - 2000.png.
[commons.wikimedia.org/ wiki/ File:Percentages_ of_ the_ us_ population_ by_ race_ -_ 2000.png]
"The United States Census Bureau defines White people as those having origins in any of the original peoples of Europe, the Middle East, or North Africa. It includes people who reported "White" or wrote in entries such as Irish, German, Italian, Lebanese, Near Easterner, Arab, or Polish. Whites constitute the majority of the U.S. population, with a total of about 245,532,000 or 77.7% of the population as of 2013. There are 62.6% Whites when Hispanics who describe themselves as "white" are taken out of the calculation. Despite major changes due to illegal and legal immigration since the 1960s and the higher birth-rates of nonwhites, the overall current majority of American citizens are still white, and English-speaking, though regional differences exist." [Demography of the United States. Wikipedia]
The exploded pie chart example "Percentages of the U.S. population by race" was created using the ConceptDraw PRO diagramming and vector drawing software extended with the Pie Charts solutiton of the Graphs and Charts area in ConceptDraw Solution Park.
Exploded pie chart
 Mathematics
Mathematics solution extends ConceptDraw PRO software with templates, samples and libraries of vector stencils for drawing the mathematical illustrations, diagrams and charts.
 Fault Tree Analysis Diagrams
This solution extends ConceptDraw PRO v9.5 or later with templates, fault tree analysis example, samples and a library of vector design elements for drawing FTA diagrams (or negative analytical trees), cause and effect diagrams and fault tree diagrams.
 Computer and Network Package
Computer and Network Package is a large set of valuable graphical solutions from ConceptDraw Solution Park, developed and specially selected to help computer network specialists and IT professionals to realize their daily work the most efficiently and quickly. This package contains extensive set of graphic design tools, ready-to-use vector elements, built-in templates and samples for designing professional-looking diagrams, charts, schematics and infographics in a field of computer network technologies, cloud computing, vehicular networking, wireless networking, ensuring networks security and networks protection. It is useful for designing different floor plans and layout plans for homes, offices, hotels and instantly construction detailed schemes of computer networks and wireless networks on them, for making professional-looking and colorful Pie Charts, Bar Graphs and Line Charts visualizing the relevant information and data.
 Flowcharts
The Flowcharts Solution for ConceptDraw PRO v10 is a comprehensive set of examples and samples in several different color themes for professionals that need to graphically represent a process. Solution value is added by basic flow chart template and shapes' library of Flowchart notation. ConceptDraw PRO flow chart creator lets one depict a processes of any complexity and length, as well design of the flowchart either vertically or horizontally.
 Business and Finance
Use Business and Finance solution to make professional-looking documents, presentations and websites, business, finance, advertising, and project management illustrations, or any designs that requires clipart of currency, office, business, advertising, management, marketing, people, time, post, contacts, collaboration, etc.
 Rack Diagrams
Rack Diagrams solution extends ConceptDraw PRO software with samples, templates and libraries of vector stencils for drawing the computer network server rack mounting diagrams.
 Audio, Video, Media
Use it to make professional-looking documents, impressive presentations, and efficient websites with colorful and vivid illustrations and schematics of digital audio, video and photo gadgets and devices, audio video connections and configurations, S Video connection, HD and 3D television systems, home entertainment systems, Closed-circuit television (CCTV) surveillance systems. All audio video schematics, drawings and illustrations designed in ConceptDraw PRO are professional looking, clear and understandable for all thanks to applying the most commonly used standards of designations, and are effective for demonstrating in front of a small audience and on the big screens.
 Wireless Networks
The Wireless Networks Solution extends ConceptDraw PRO software with professional diagramming tools to help network engineers and designers efficiently design and create wireless network diagrams that illustrate wireless networks of any speed and complexity.
- Percentage Pie Chart . Pie Chart Examples | Atmosphere air ...
- Percentage Pie Chart . Pie Chart Examples | Atmosphere air ...
- Schedule pie chart - Daily action plan | How to Draw a Pie Chart ...
- Fault Calculation Example
- Load Schedule Calculation
- Percentages of the U.S. population by race | Pie Charts | Aerospace ...
- Draw A Pie Chart Showing Different Gases And Their Percentage In
- Pie Charts | Percentages of the U.S. population by race | Bar Graphs ...
- Diagram And Pie Chart For Wireless Communication
- ConceptDraw Solution Park | How to Create a Pie Chart | Windows 8 ...
- Percentages of the U.S. population by race | Pie Charts | Chart ...
- Sales Growth. Bar Graphs Example | Create Graphs and Charts ...
- Exploded pie chart - European Parliament election | Europe browser ...
- State Diagram Calculator
- Atmosphere air composition | Percentage Pie Chart . Pie Chart ...
- Bar Multiple Histogram Pie Chart In Economics Examples
- Domestic sector SWOT | Pie chart - Domestic energy consumption ...
- Pie Chart Examples and Templates | Aircraft examples | Percentage ...
- Schedule pie chart - Daily action plan | Process Flowchart | Basic ...