 Business Diagrams
The Business Diagrams Solution extends ConceptDraw DIAGRAM with an extensive collection of professionally designed illustrative samples and a wide variety of vector stencils libraries, which are the real help for all business-related people, business analysts, business managers, business advisers, marketing experts, PR managers, knowledge workers, scientists, and other stakeholders allowing them to design the bright, neat, expressive and attractive Bubble Diagrams, Circle-Spoke Diagrams, Circular Arrows Diagrams, and Venn Diagrams with different quantity of sets in just minutes; and then successfully use them in documents, reports, statistical summaries, and presentations of any style.
Product Proposal Data
The main purpose of any businessman is to grow its business. There are many techniques and ways to provide and advance the information about a new product or service. One of them is a proposal, it is a written set of offered products or services by a seller to the consumers. The new product proposal is a popular business tool that plays the great role in business promotion and increasing the sales of a company. It visually outlines the objectives, ideas, features and functions of a new product. A good proposal is a perfect way to attract new consumers and increase amounts of sales. In this regard it is essential to know how to make correct and effective product proposals, because the correctly made product proposal or a presentation is a key to success of your business. The effective product proposal helps your business to feel good and attract a lot of new customers, and thus to boost sales and win in conditions of competition. This Mind Map created in ConceptDraw MINDMAP organizes the data of a product proposal.Donut Chart Templates
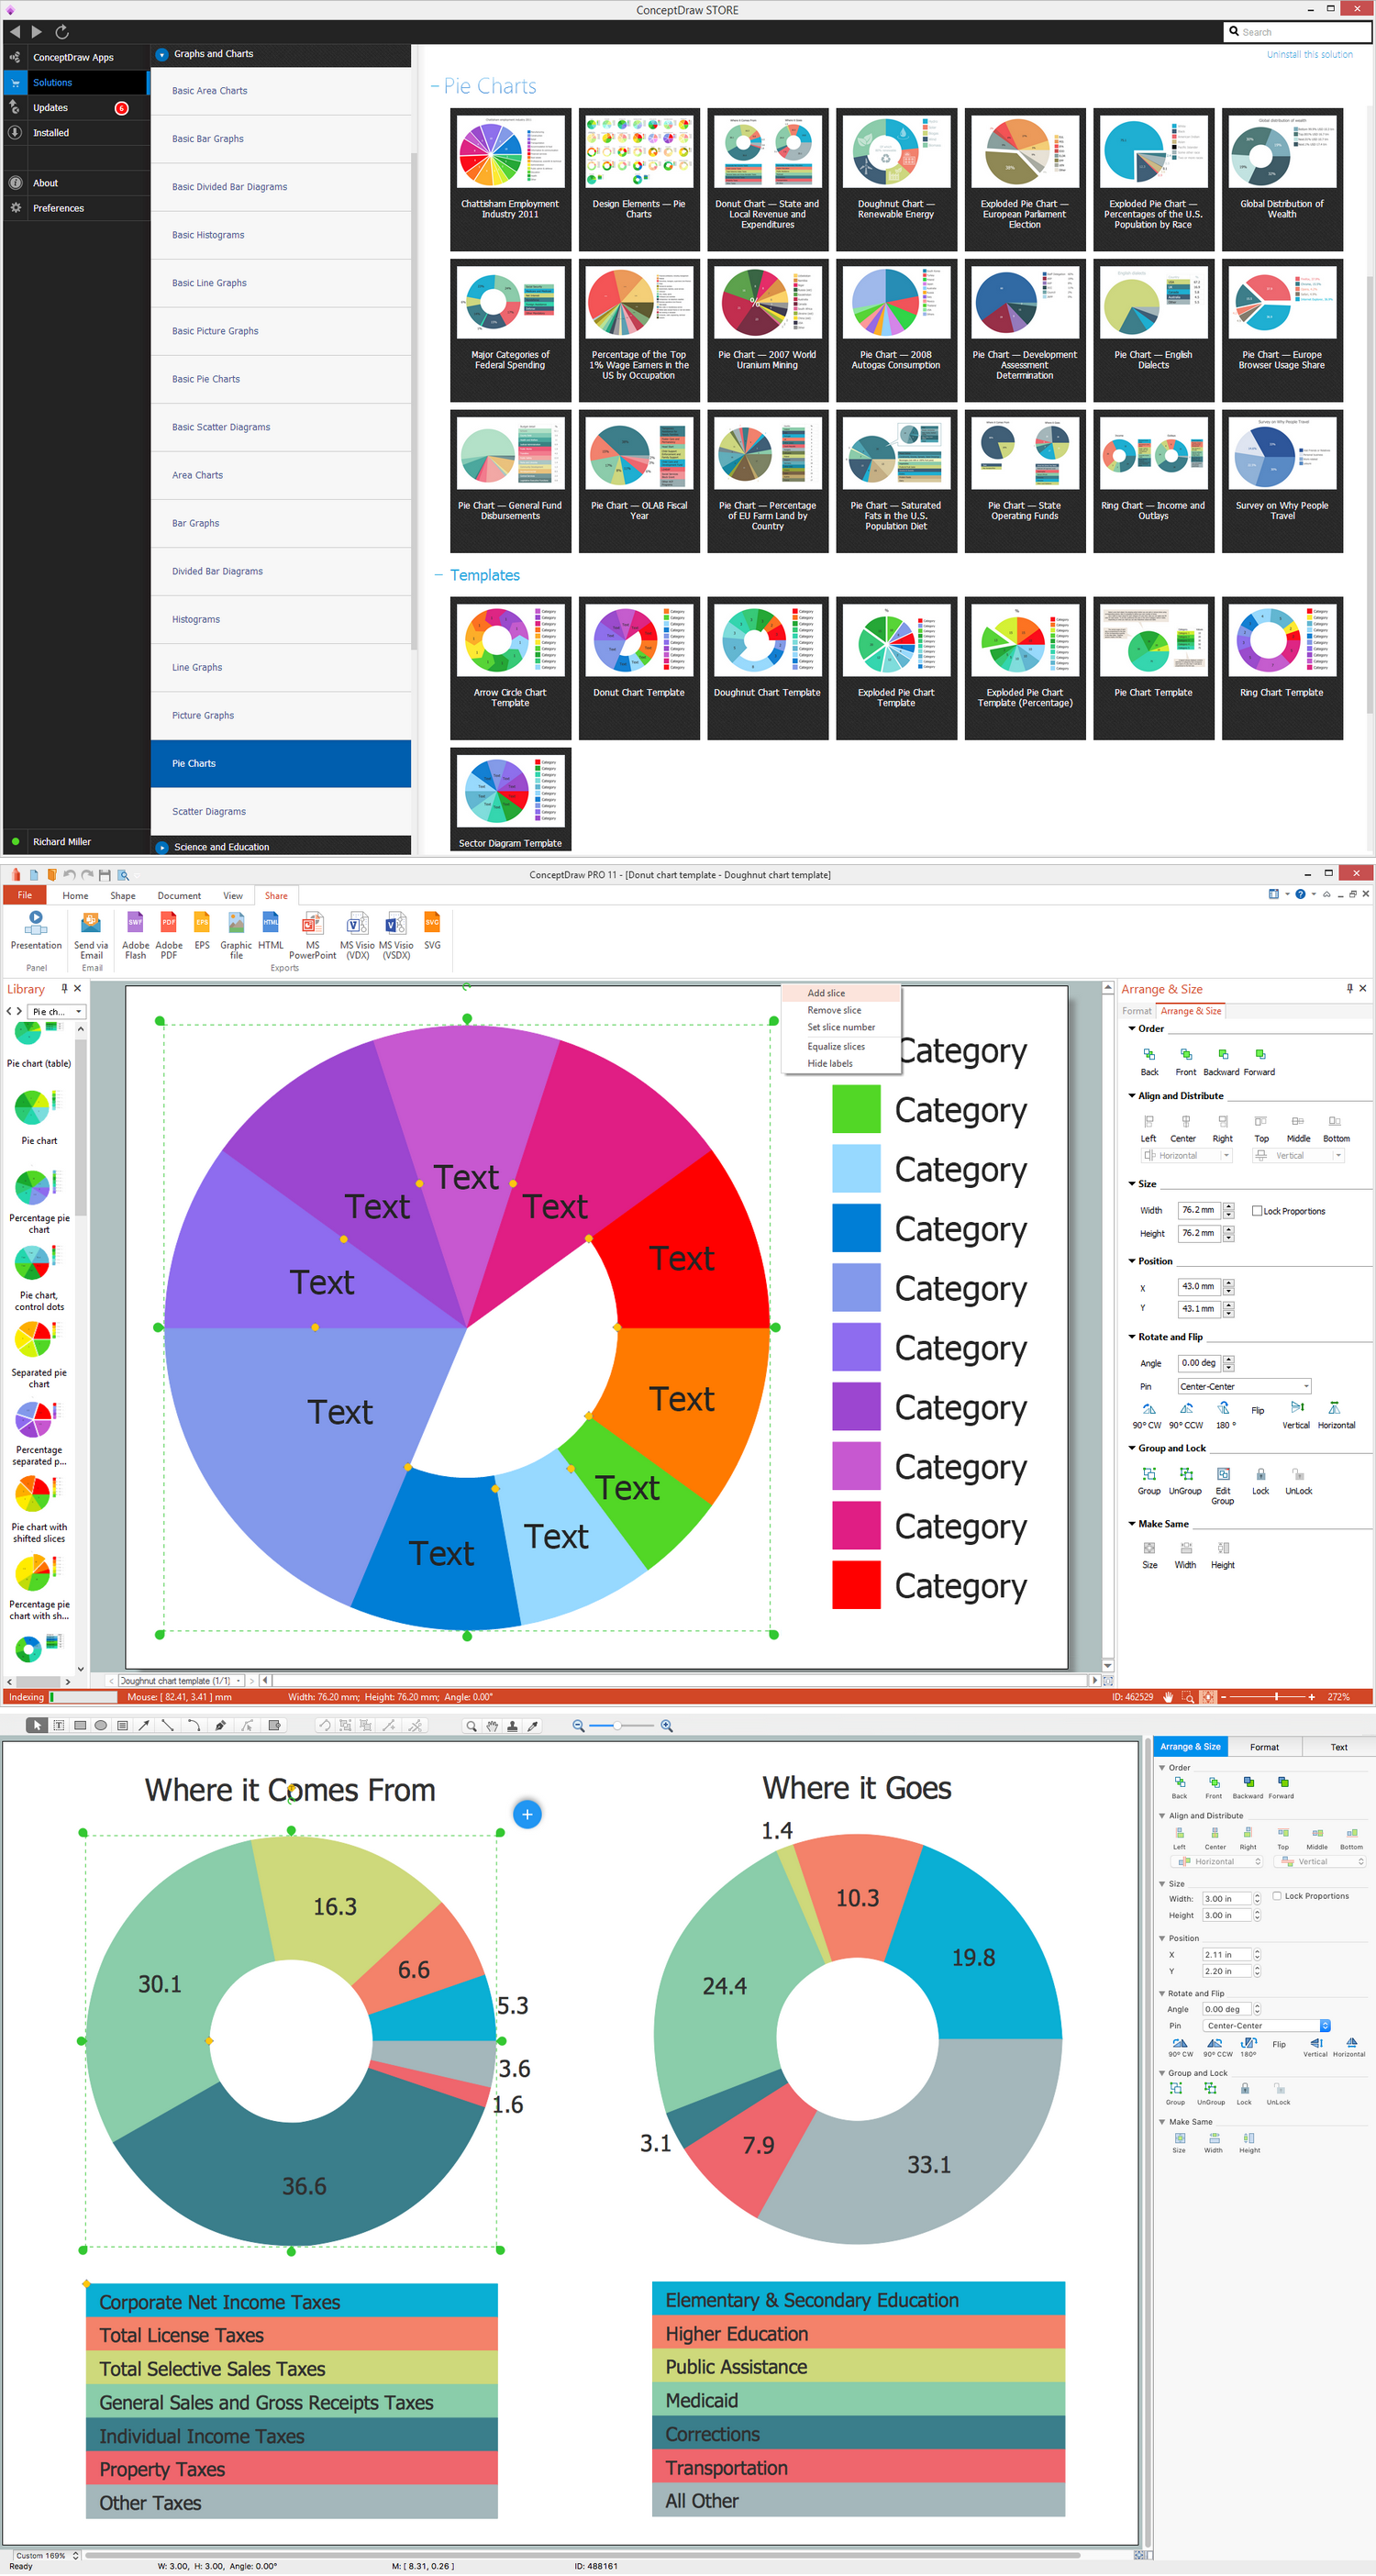
These donut chart templates was designed using ConceptDraw DIAGRAM diagramming and vector drawing software extended with Pie Charts solution from Graphs and Charts area of ConceptDraw Solution Park. All these donut chart templates are included in the Pie Charts solution. You can quickly rework these examples into your own charts by simply changing displayed data, title and legend texts.Create a Presentation Using a Design Template
The intuitive interface of ConceptDraw MINDMAP and the Functional Tools overview below will guide you in creating and demonstrating powerful mind map presentations using template. An advanced tool allows you effectively generate, change, and update your presentation.SWOT Analysis
The success of the company depends on how successfully it is able to react on different outside influences. When analyzing the external situation, it is necessary to identify the factors most significant on a specified period of time. An interrelated consideration of these factors with the company's possibilities allows to solve effectively appearing problems. One of the most common methods of assessment together internal and external factors influencing the company's development is a SWOT analysis. SWOT analysis (acronym composed of the first letters of the words: strength, weakness, opportunities, threats) is one of the most common and effective types of analysis in marketing and marketing researches. It allows to identify and structure the strengths and weaknesses of an enterprise, as well as potential opportunities and threats of the market, to make conclusion in which direction a given organization needs to develop its business and to formulate the organization's strategy. Use the ConceptDraw MINDMAP software and offered SWOT analysis templates for easy holding SWOT analysis for your company. This Mind Map displays the SWOT analysis for a company and variety of performance measures that influence its work.
 Mind Map Exchange
This solution extends ConceptDraw MINDMAP software with the ability to easily exchange mind maps with a large variety of other mind mapping applications, including Mindjet MindManager, FreeMind, XMind, project management software ConceptDraw PROJECT and Microsoft Project, also other Microsoft Office products, etc.
 HR Flowcharts
The HR Flowcharts solution is ideal for using while creating the HR-related drawings in the ConceptDraw DIAGRAM charting and drawing software, providing with a comprehensive collection of human resources themed icons, connectors, and images from the available stencil libraries, helping illustrating flowcharts, infographics and workflow diagrams.
Infographic Software
ConceptDraw DIAGRAM extended with Pictorial Infographics Solution from the “Infographics” Area is a powerful Infographic Software. Make sure in it right now! Network Visualization Guide.How to Use ConceptDraw Network Visualization Tool
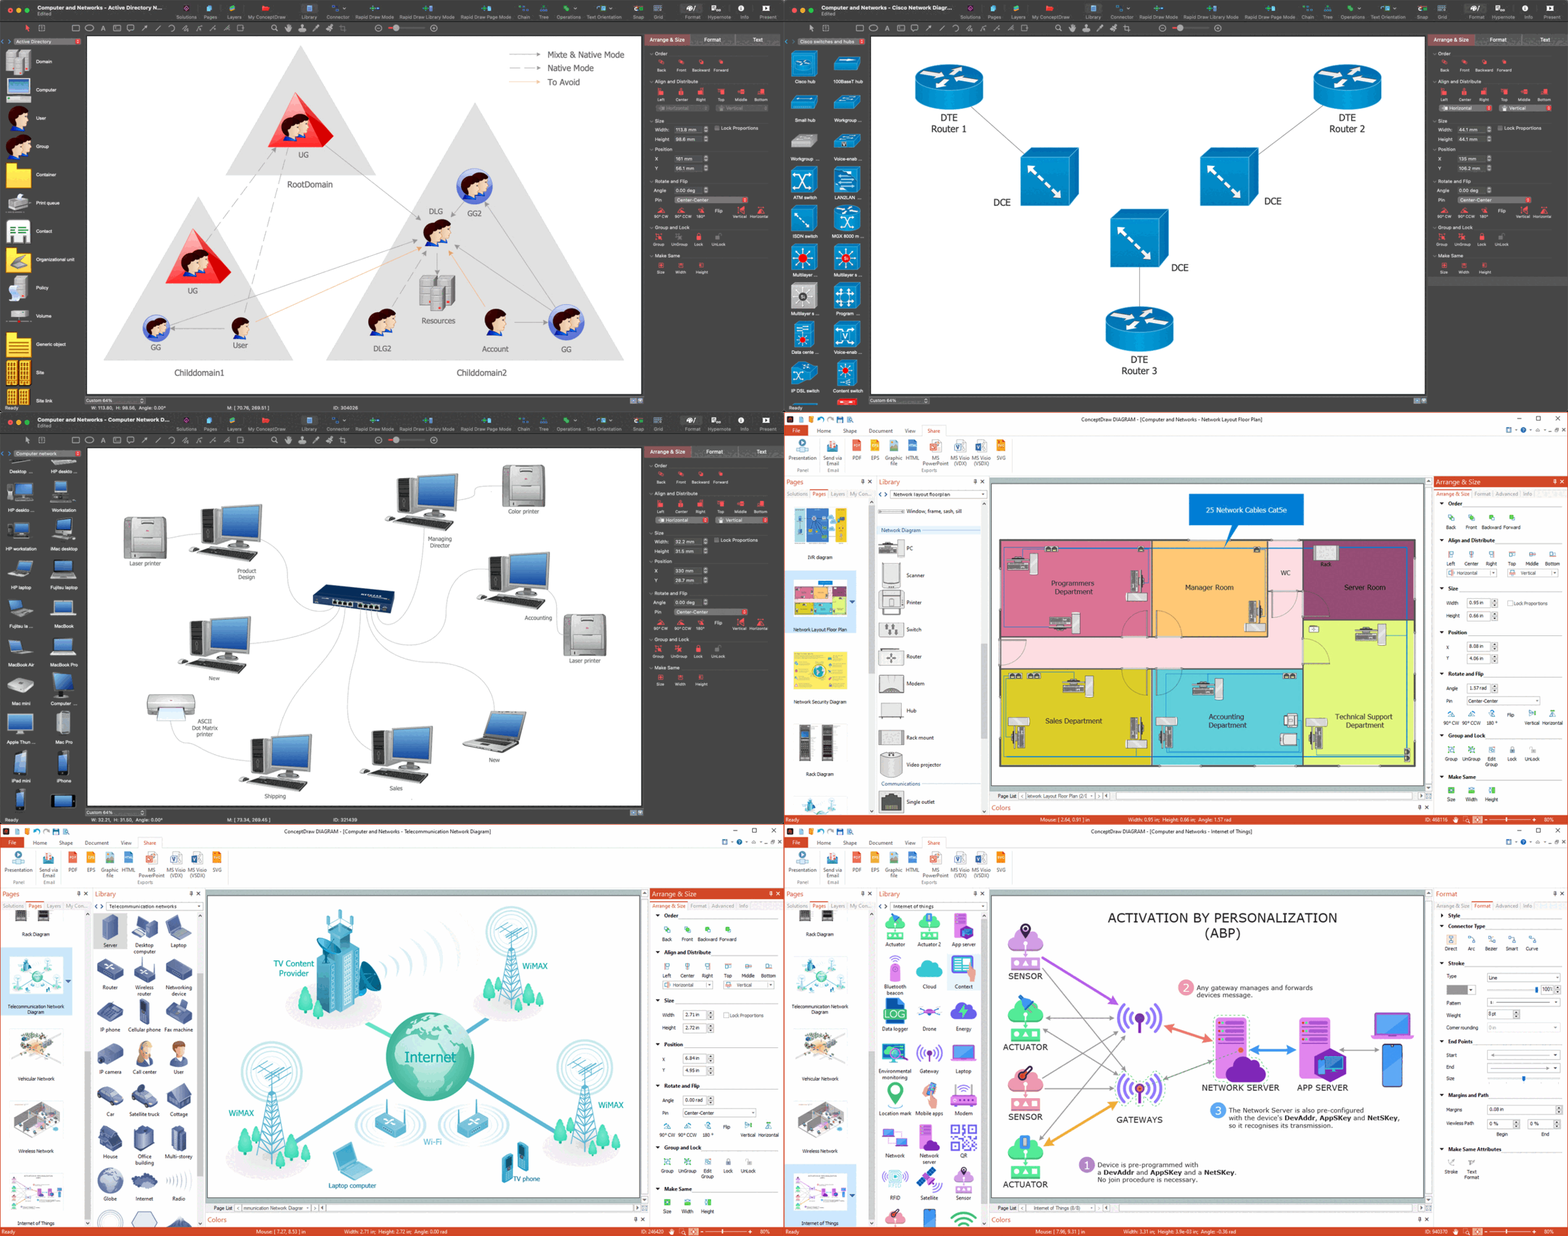
ConceptDraw DIAGRAM makes the entire process of network visualization easier thanks to the numerous ready-to-use objects included in the package for presentation of network equipment, LDAP directory symbols and many other objects that symbolize resources in most various representations.
Network diagrams with ConceptDraw DIAGRAM
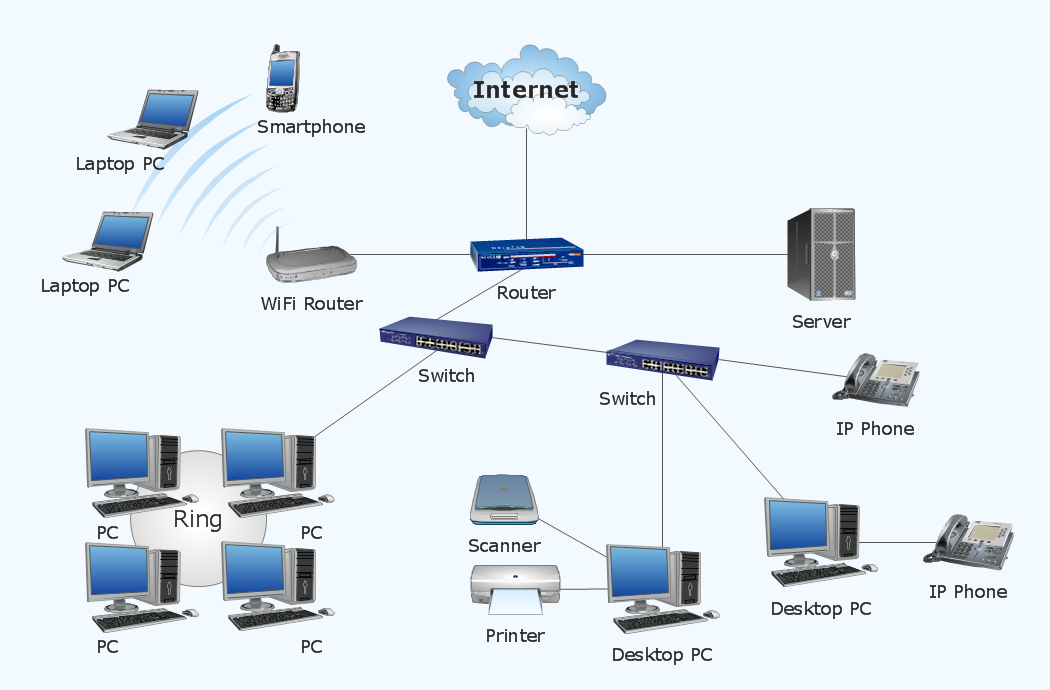
Network diagram is effective tool for representing and description the network knots and connections between them in comprehensible graphic view, for studying and analysis them. The network administrators and engineers actively use Physical Network Diagrams and Logical Network Diagrams, which are both indispensable when developing and documenting new networks, and managing existing ones. Network diagrams let clearly represent the network configuration and structure, used protocols, addresses, and also names of network objects. Physical Network Diagrams depict the information about telecommunications data, servers, location of network equipment and number of network users. Logical Network Diagrams describe about logical network structure. It is useful to use the ready sets of network clipart, pictures and symbols for indication the network knots on a diagram, such as developed by professionals and offered in large quantity by Computer Network Diagrams solution from ConceptDraw Solution Park.Good Flow Chart app for Mac
The ConceptDraw DIAGRAM is a good flow chart app for Mac. Numerous vector stencils, samples and templates created by designers allows you to draw any type of flowchart.Sample Pictorial Chart. Sample Infographics
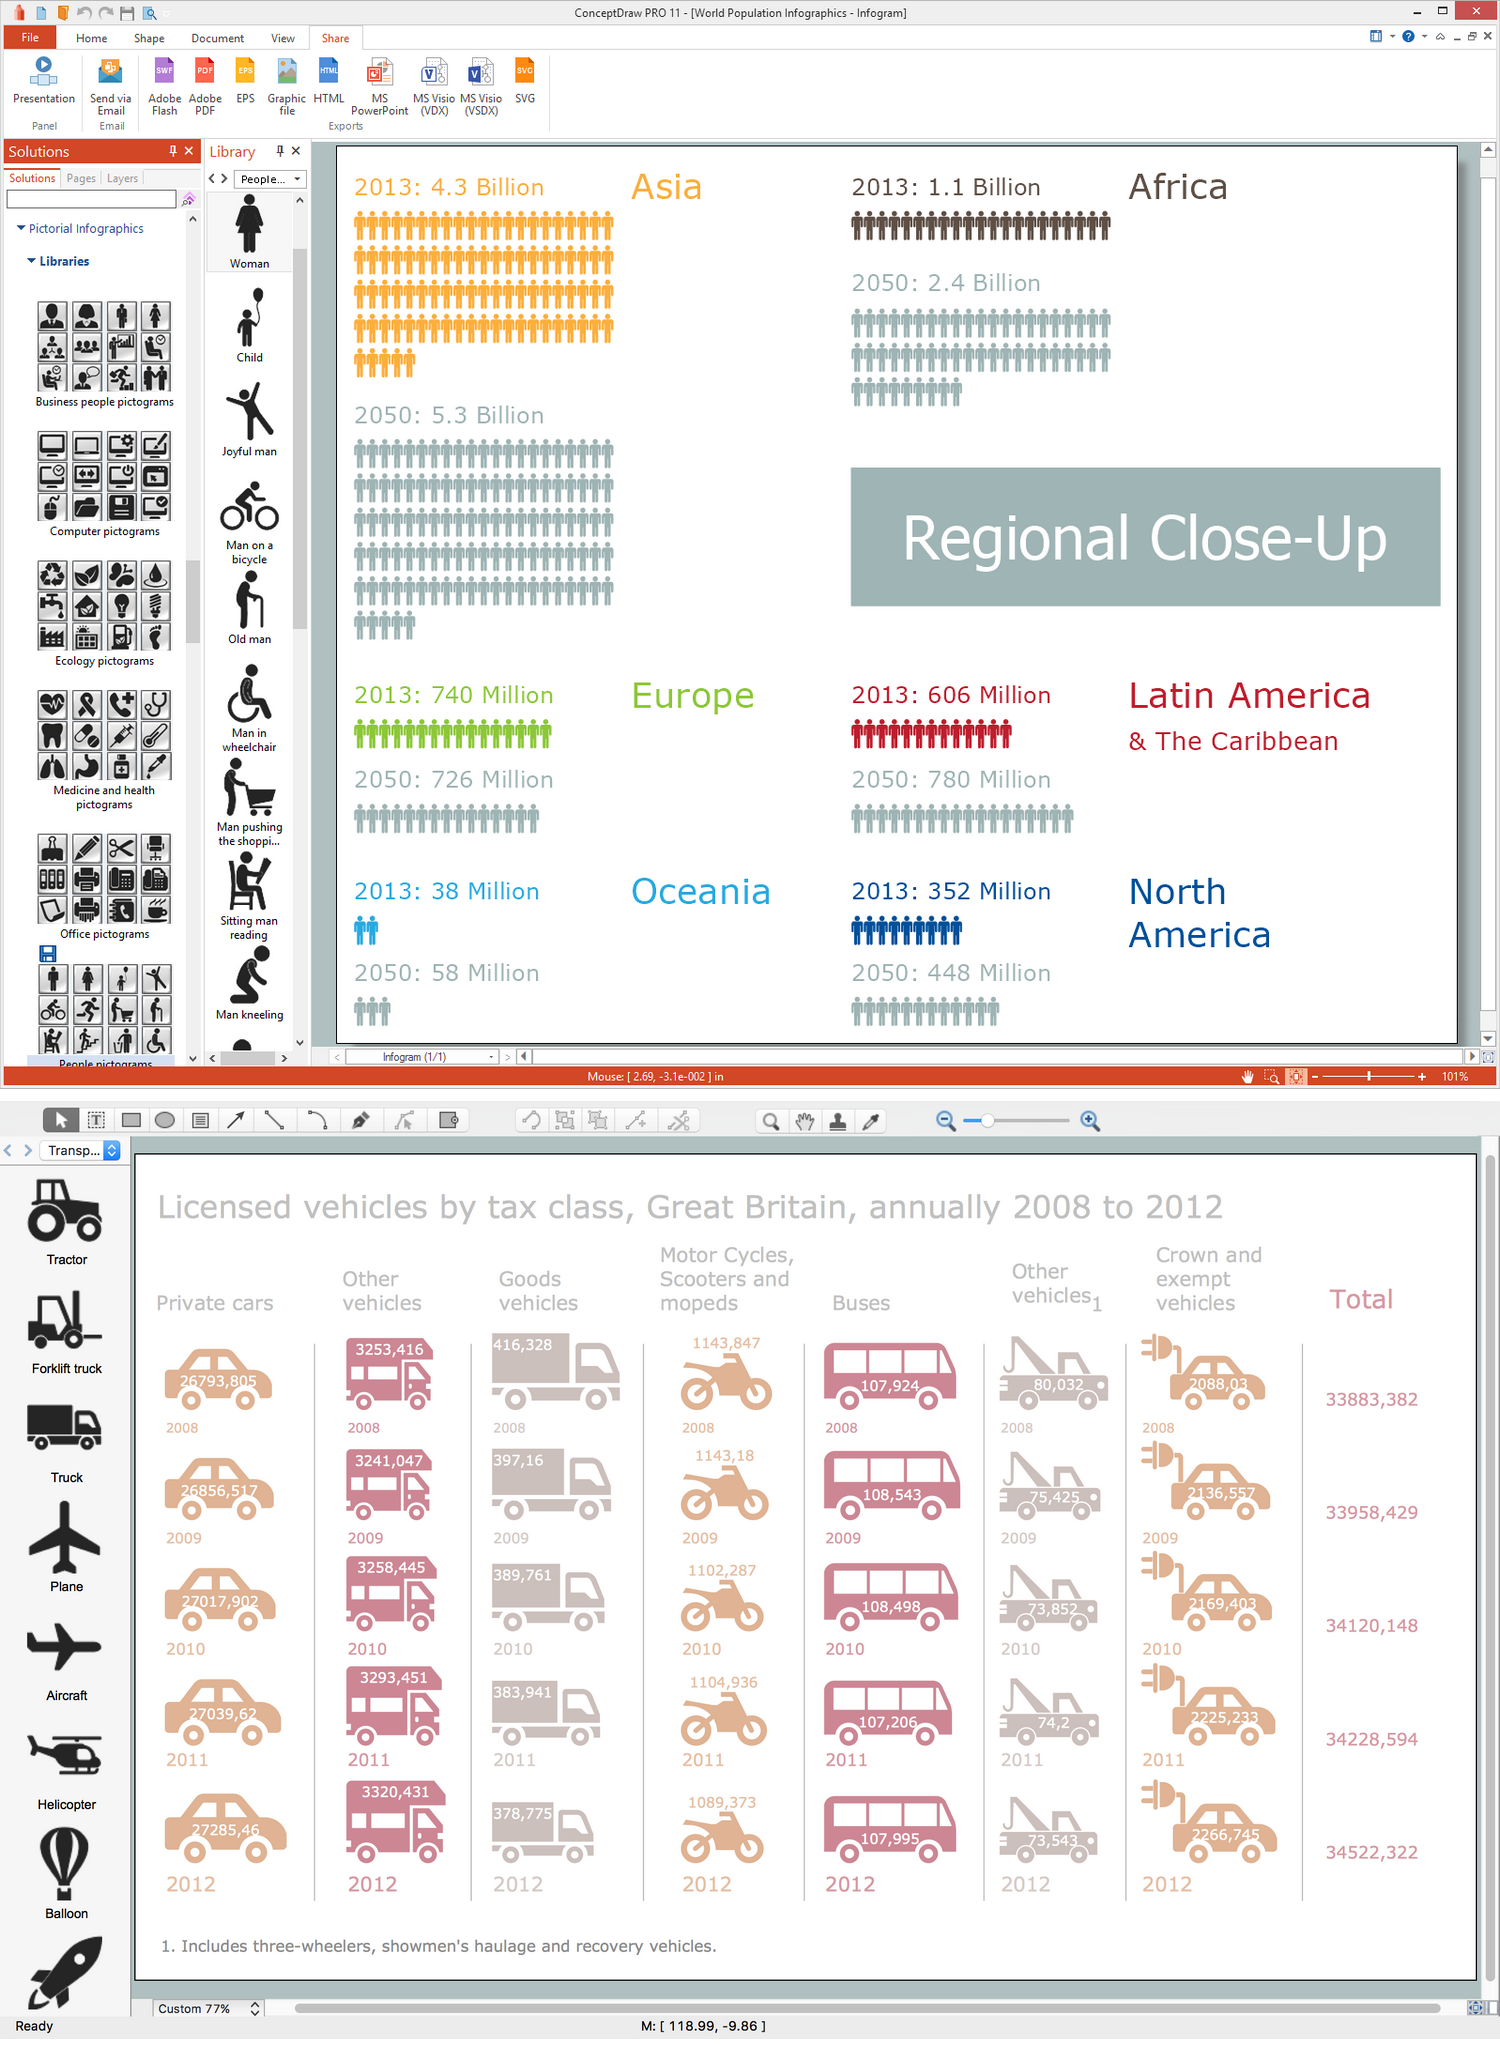
Sample Pictorial Chart - Pictorial Infographics solution provides easy-to-use design infographics drawing tools, large collection of different sample infographics and infograms, sample pictorial chart and templates to be filled in, and 10 libraries with great quantity of predesigned vector pictograms. Use Pictorial Infographics solution to draw your own design pictorial infographics documents quick and easy.Chart Templates
Easy charting software comes with beautiful chart templates and examples. This makes it easy to create professional charts without prior experience.Marketing and Sales Organization chart. Organization chart Example
The use of Organization Charts is very popular at the fields of marketing and sales. They help to depict in a visual form a lot of information about organization: the company's structure, relationships of positions within an organization in terms of authorities and responsibilities, and company's strategies. All Organizational Charts are constructed from the similar building blocks (rectangles and lines), this makes them easily for interpretation and understanding by all interested people inside and outside of this company, such as shareholders, employees, investors, distributors, suppliers, customers, etc. Organization Charts can be hand-drawn on the paper, however the preferable is to use a special software. ConceptDraw DIAGRAM diagramming and vector graphics software extended with useful Organizational Charts solution is ideal for easy representing information and data, and professional drawing Marketing and Sales Organization Chart with any depth of detailing. Organizational structure may differ during the company's development, you can design and compare the charts on each stage.Geo Map — USA — Tennesse
Tennessee is a U.S. state located in the Southeastern United States. The vector stencils library Tennesse contains contours for ConceptDraw DIAGRAM diagramming and vector drawing software. This library is contained in the Continent Maps solution from Maps area of ConceptDraw Solution Park.
 Healthcare Management Workflow Diagrams
Healthcare Management Workflow Diagrams solution contains large set of colorful samples and libraries with predesigned vector pictograms and symbols of health, healthcare equipment, medical instruments, pharmaceutical tools, transport, medication, departments of healthcare organizations, the medical icons of people and human anatomy, flowchart objects, connectors, and arrows, which make it the best for designing clear and comprehensive Medical Workflow Diagrams and Block Diagrams, Healthcare Management Flowcharts and Infographics, Healthcare Workflow Diagram, for depicting the healthcare workflow and clinical workflows in healthcare, for making the workflow analysis healthcare and healthcare workflow management.
Draw Company Structure with Organization Charting Software
Draw Company Structure Diagram - get the detailed information about the company structure and hierarchy - who execute what tasks and who is in charge at this company. This information shows the reasoning and success of business and is indispensable for investors and financial institutions.
 Circular Arrows Diagrams
Circular Arrows Diagrams solution extends ConceptDraw DIAGRAM with extensive drawing tools, predesigned samples, Circular flow diagram template for quick start, and a library of ready circular arrow vector stencils for drawing Circular Arrow Diagrams, Segmented Cycle Diagrams, and Circular Flow Diagrams. The elements in this solution help managers, analysts, business advisers, marketing experts, scientists, lecturers, and other knowledge workers in their daily work.
Create Organizational Chart
ConceptDraw DIAGRAM software is greatly powerful in many fields due to the large collection of provided solutions by ConceptDraw Solution Park, among them the cost effective Organizational Chart design capabilities. Organizational Charts Solution from the Management Area of ConceptDraw Solution Park perfectly suits for analyzing the organizational structures, visualizing and designing Organizational Charts for the companies of any sizes, for creation the hotel organizational chart, hospital organizational chart, corporate organizational chart, different flow charts, time lines, and much more. Organizational Charts Solution makes ConceptDraw DIAGRAM the perfect analyzer tool for managers and administrative staff. It offers plenty of useful and convenient tools for ConceptDraw DIAGRAM users, including the set of Organizational chart templates that make the process of creation Organizational Charts on their base easier and quicker, extensive Organizational chart library of tasks-specific symbols and shapes, helpful Organizational chart examples and samples.- Entity-Relationship Diagram (ERD) | SWOT Analysis | HR ...
- SWOT Analysis | Orgchart | Presentation Of Data For Partnership Firm
- SWOT Analysis | Orgchart | SWOT Matrix Software | Presentation Of ...
- Entity-Relationship Diagram (ERD) | Orgchart | Create ...
- Flow chart Example. Warehouse Flowchart | Data And Information ...
- Process Flowchart | Example of DFD for Online Store ( Data Flow ...
- Create Organizational Chart | Orgchart | Entity-Relationship Diagram ...
- Chart Examples | Presentation Of Data And Information Of Dissolution
- Flow chart Example. Warehouse Flowchart | Business Process ...
- Entity-Relationship Diagram (ERD) | Presentation Of Data Firm

