Network Diagram Examples
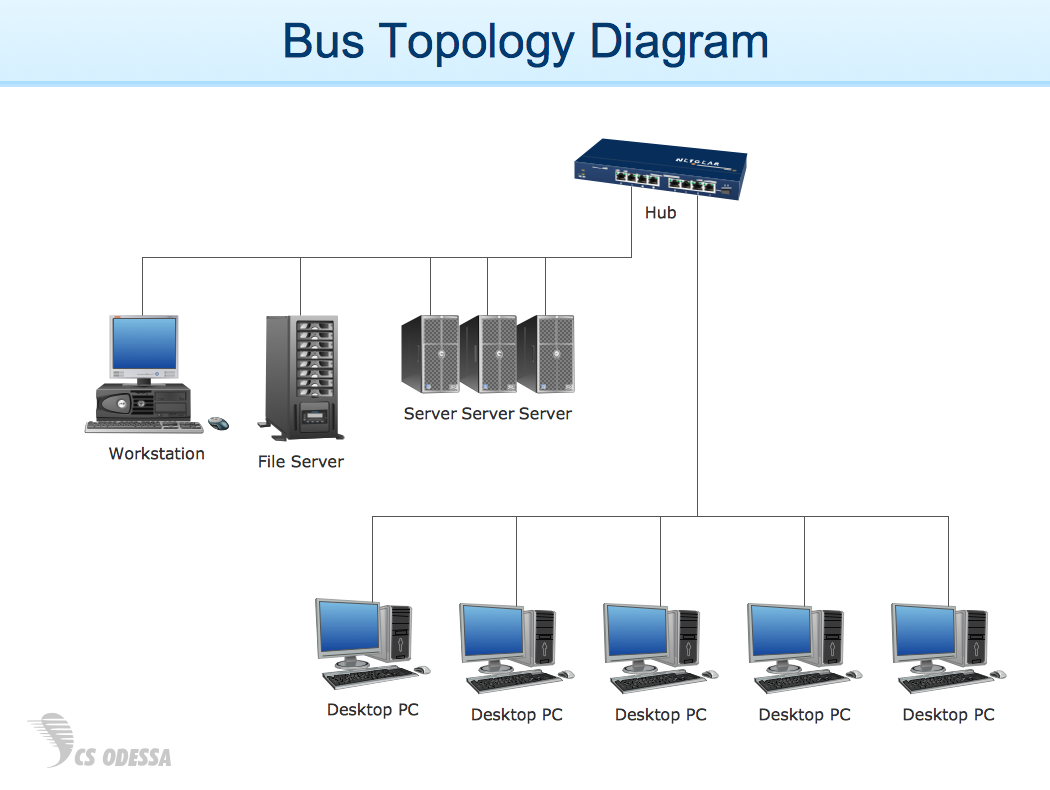
Network diagram is a chart which represents nodes and connections between them in computer network or any telecommunication network, it is a visual depiction of network architecture, physical or logical network topology. There are used common icons for the Network diagrams design, such as icons of various network appliances, computer devices, routers, clouds, peripheral devices, digital devices, etc. Network diagrams can represent networks of different scales (LAN level, WAN level) and detailization. ConceptDraw DIAGRAM diagramming software enhanced with Computer Network Diagrams solution from Computer and Networks area includes huge collection of computer and network templates, design objects and stencils, and numerous quantity of Network diagram examples and samples, among them: Basic Computer Network Diagrams, Communication Network Diagram, Wireless Router Network Diagram, LAN Topology Diagram, Computer Network System Design Diagram, Mobile Satellite Communication Network, Web-based Network Diagram, Hybrid Network Diagram, and many others.
HelpDesk
How to Draw a Chemical Process Flow Diagram
Process Flow Diagram widely used in modeling of processes in the chemical industry. A Chemical Process Flow diagram (PFD) is a specialized type of flowchart. With the help of Chemical Process Flow Diagram engineers can easily specify the general scheme of the processes and chemical plant equipment. Chemical Process Flow Diagram displays the real scheme of the chemical process, the relationship between the equipment and the technical characteristics of the process. Chemical Process Flow Diagram illustrates the connections between the basic equipment as well as the overall structure of pipelines and other supporting equipment. The purpose of the PFD is to build the image of the basic idea of the chemical process. ConceptDraw DIAGRAM together with its Chemical and Process Engineering solution delivers the possibility to design Chemical Process Flow diagrams. It is designed for chemical industry engineers and designers.
 Event-driven Process Chain Diagrams
Event-Driven Process Chain Diagrams solution extends ConceptDraw DIAGRAM functionality with event driven process chain templates, samples of EPC engineering and modeling the business processes, and a vector shape library for drawing the EPC diagrams and EPC flowcharts of any complexity. It is one of EPC IT solutions that assist the marketing experts, business specialists, engineers, educators and researchers in resources planning and improving the business processes using the EPC flowchart or EPC diagram. Use the EPC solutions tools to construct the chain of events and functions, to illustrate the structure of a business process control flow, to describe people and tasks for execution the business processes, to identify the inefficient businesses processes and measures required to make them efficient.
HelpDesk
How to Make an Ansoff Matrix Template
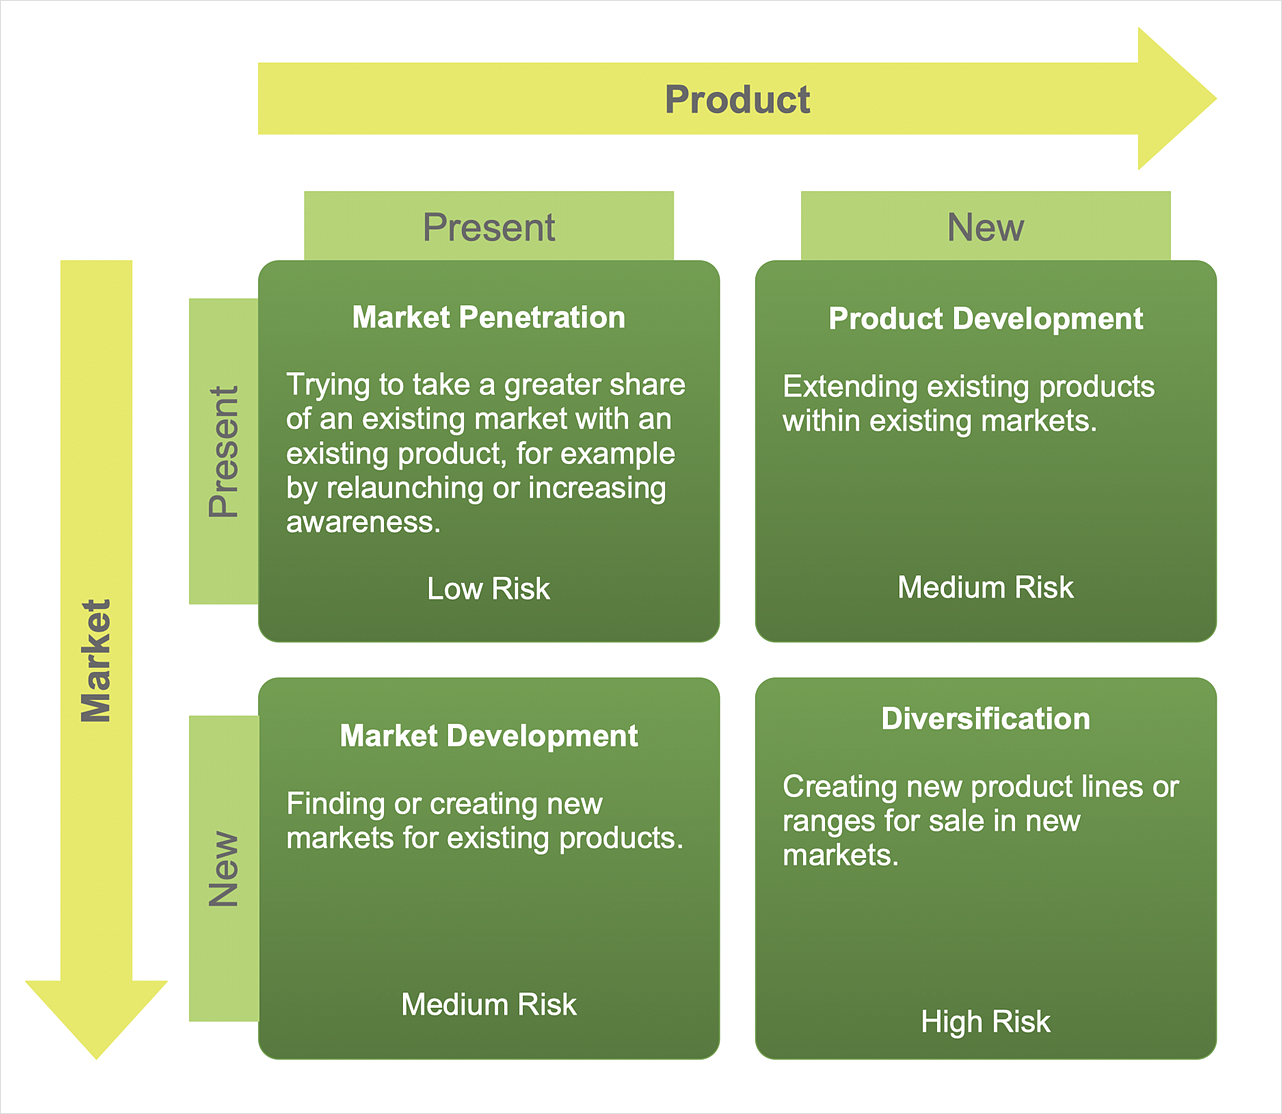
Ansoff Matrix is a business strategic management tool that helps a business determine its product and market growth strategy. Ansoff matrix has four sections to show each impacting ways that businesses can grow. Using Ansoff Matrix enables determining the current position of any business in the industry and choose the direction of its growth, which would provide the most competitive position. While Ansoff Matrix is most commonly used as a business planning tool it can be used also for personal development. You can make Ansoff Matrix template for your organization using ConceptDraw DIAGRAM Matrices solution.- Building Networks | How to Draw a Computer Network Diagrams ...
- How To Draw Building Plans | Network Diagram Examples | Network ...
- Home area networks (HAN). Computer and Network Examples ...
- Design Elements - Telecommunication networks | Hybrid satellite ...
- Wireless broadband network diagram | Illustrate the Computer ...
- Electrical Drawing Software | How To use House Electrical Plan ...
- Physical LAN and WAN diagram template | Computer network ...
- Local area network (LAN) diargam | Network Architecture | Physical ...
- Office wireless network plan | Network Diagram Examples | Wireless ...
- Satellite network diagram | Network diagrams with ConceptDraw ...
- Network Diagram Software Home Area Network | Diagram of a Basic ...
- Network Printer | Computer network diagram | Logical network ...
- Computer network system design diagram | Computer and Networks ...
- Wide area network (WAN) topology. Computer and Network ...
- Telecommunication Network Diagrams | Design elements ...
- Local Area Network Diagram
- Wireless Networks | Illustrate the Computer Network of a Building ...
- Telecommunication Network Diagrams | How to Create ...
- Home area networks (HAN). Computer and Network Examples ...
- Business Productivity Diagramming | TQM Software — Build ...


