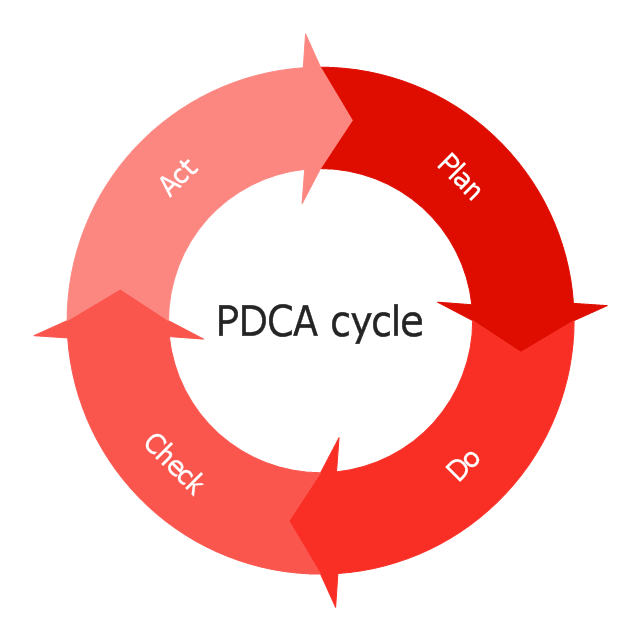
This circular arrows diagram sample depicts the Plan–Do–Check–Act cycle.
"PDCA (plan–do–check–act or plan–do–check–adjust) is an iterative four-step management method used in business for the control and continuous improvement of processes and products. It is also known as the Deming circle/ cycle/ wheel, Shewhart cycle, control circle/ cycle, or plan–do–study–act (PDSA). Another version of this PDCA cycle is OPDCA. The added "O" stands for observation or as some versions say "Grasp the current condition." This emphasis on observation and current condition has currency with Lean manufacturing/ Toyota Production System literature." [PDCA. Wikipedia]
The diagram example "PDCA cycle" was created using the ConceptDraw PRO diagramming and vector drawing software extended with the Circular Arrows Diagrams solution from the area "What is a Diagram" of ConceptDraw Solution Park.
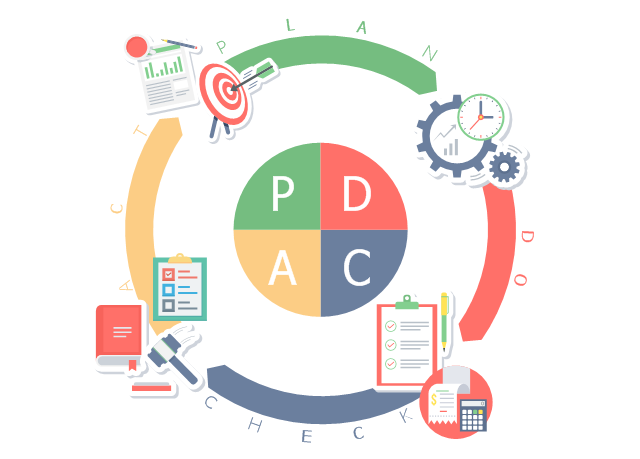
This business infographic sample shows the plan–do–check–act cycle. It was designed on the base of the Wikimedia Commons file: PDCA-Cycle.png.
[commons.wikimedia.org/ wiki/ File:PDCA-Cycle.png]
This file is licensed under the Creative Commons Attribution-Share Alike 3.0 Unported license. [creativecommons.org/ licenses/ by-sa/ 3.0/ deed.en]
"PDCA (plan–do–check–act or plan–do–check–adjust) is an iterative four-step management method used in business for the control and continual improvement of processes and products. It is also known as the Deming circle/ cycle/ wheel, Shewhart cycle, control circle/ cycle, or plan–do–study–act (PDSA)." [PDCA. Wikipedia]
The business infographic example "PDCA cycle" was designed using ConceptDraw PRO diagramming and vector drawing software extended with the Business and Finance solution from Illustration area of ConceptDraw Solution Park.
Circular Arrow
ConceptDraw PRO diagramming and vector drawing software extended with Circular Arrows Diagrams solution from the "Diagrams" Area is a powerful software that will help you design professional looking Circular Arrow Diagrams.Audit Process Flowchart. Audit Flowchart
Audit Process Flowchart, Audit Flowchart - Audit Flowcharts solution for ConceptDraw PRO Solution Park provides the Audit Flowcharts library with wide variety of predesigned audit flowchart symbols, and also the set of templates and samples allowing you design your own audit flowchart or audit process flowchart in one moment. Simply use any of offered samples and change it for your needs, or fill the desired template.
 Basic Circular Arrows Diagrams
This solution extends ConceptDraw PRO v10 (or later) with samples, templates, and a library of vector stencils for drawing circular arrow diagrams.
Total Quality Management Value
The Total quality management (TQM) is an enterprise-wide method of continuous quality improvement of all organizational processes, including the enhancement of ability to deliver high-quality products and services to the customers. The TQM includes eight main elements, which have great value: customer-focused, process-centered, total employee involvement, integrated system, continual improvement, strategic and systematic approach, fact-based decision making, communications. ConceptDraw PRO diagramming and vector drawing software offers the Total Quality Management Diagram solution with effective drawing tools, predesigned vector elements, samples and templates that help easy design the Total Quality Management diagrams, TQM flowcharts and Mind Maps widely used in quality management projects to visualize the business processes and industrial processes for your organization, to demonstrate the quality control step-by-step in a visual manner, to compare visually the ideal and real stages of processes.- Pdca Cycle Vector
- PDCA cycle | Project management - Vector stencils library ...
- How to Draw a Landscape Design Plan | PDCA cycle | Marketing ...
- Circular Arrow | Basic Circular Arrows Diagrams | Clipart Pdca Cycle
- PDCA cycle | Basic Circular Arrows Diagrams | P D C A Cycle ...
- Affinity diagram - Business expansion | BPM life cycle | PDCA cycle ...
- PDCA cycle | Basic Circular Arrows Diagrams | Think. Act ...
- Flat Design Pdca
- Circular Arrow | Basic Circular Arrows Diagrams | Pdca Cycle ...
- Pdca Cycle Examples
- Circular arrows diagram - PDCA cycle | Circular Arrow | Circular ...
- PDCA cycle | Circular arrows diagram - PDCA cycle | Total Quality ...
- Circular arrows diagram - PDCA cycle | Circular Arrow | Basic ...
- BPR Diagram. Business Process Reengineering Example | PDCA ...
- Circular arrows diagram - PDCA cycle | Flow chart Example ...
- Water cycle diagram | Circular arrows diagram - PDCA cycle ...
- Circular arrows diagram - PDCA cycle | BPM life cycle | Circular ...
- Circular arrows diagram - PDCA cycle | Circular arrows diagram ...
- Circular arrows diagram - PDCA cycle | Europe browser usage ...
- Pdca Template


