HelpDesk
How to Create Flowchart Using Standard Flowchart Symbols
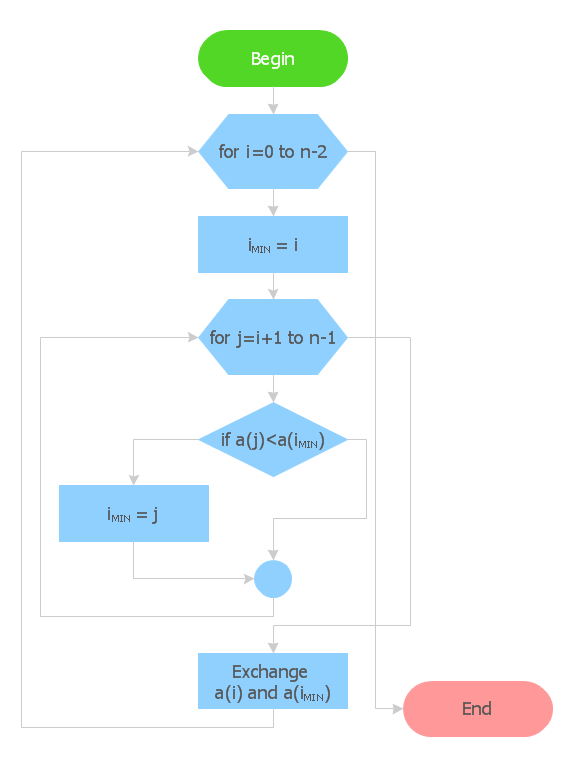
Flowcharts are used to display an algorithm for consistent execution of certain steps. Flowchart is probably the easiest way to make a graphical representation of any process. Flowcharts use the set of standard geometric symbols and arrows to define relationships. ConceptDraw PRO allows you to create professional flowchart quickly and easily. The ability to create flowcharts is contained in the Flowcharts solution. The solution provides a set of special tools for creating flowcharts.This double bar chart example was drawn on the base of picture "Nitrate Concentration (milligrams per liter; mg/ L) in Community Water Systems (CWS), Mean and Maximum by Year, New Mexico 1999-2012" from the New Mexico's Indicator-Based Information System (NM-IBIS) website.
"Nitrate toxicity is a preventable cause of methemoglobinemia (blue baby syndrome), especially in infants. Infants younger than 4 months of age are at greatest risk of toxicity from nitrate-contaminated drinking water.
These infants are more susceptible to developing methemoglobinemia because the pH of their gut is normally higher (less acidic) than in older children and adults. The higher pH enhances the conversion of ingested nitrate to the more toxic nitrite. The bacterial flora of a young infant's gut is also different from that found in older children and adults and might be more likely to convert ingested nitrate to nitrite. Gastroenteritis can increase body transformation of nitrate to nitrite and absorption into the bloodstream of nitrite from the large intestine.
A large proportion of hemoglobin in young infants is in the form of fetal hemoglobin. Fetal hemoglobin is more readily oxidized to methemoglobin (MHg) by nitrites than is adult hemoglobin. In addition, in infants, the enzyme (NADH-dependent methemoglobin reductase) responsible for reduction of formed MHg back to normal hemoglobin has only about half the activity it has in adults.
Symptoms such as shortness of breath and bluish skin coloring around the mouth, hands, or feet, can occur in infants rapidly over a period of days. If the condition is severe, it could lead to convulsions, coma, and even death, if untreated. Most older children and adults can take in larger amounts of nitrate without experiencing the same health effects as infants. However, pregnant women, nursing mothers, and people with low stomach acid conditions or those deficient in an enzyme that changes MHg back to normal hemoglobin are more susceptible to nitrate-induced methemoglobinemia and could be affected by water with nitrate levels above 10 mg/ L.
Adverse reproductive outcomes such as spontaneous abortions, intrauterine growth retardation, and various birth defects such as anencephaly have been reported in scientific literature from exposure to high nitrate levels in drinking water; however, the evidence is inconsistent.
Little is known about possible health effects from high nitrate level exposure over a long period of time. However, some studies suggest that there might be a risk of stomach, esophageal or bladder cancers in people with prolonged ingestion of high levels of nitrate. This might be due to the formation of nitrosoamines in the body following ingestion exposure to high levels of nitrate.
International Agency for Research on Cancer (IARC) classified ingested nitrate or nitrite as probably carcinogenic to humans (Group 2A) under conditions that result in formation of nitroso-compounds (e.g., nitrosoamines) in the body (endogenous nitrosation)." [ibis.health.state.nm.us/ indicator/ view/ CommWaterNitrates.MeanMax.Year.html]
The double bar graph example "Nitrate concentration in Community Water Systems (CWS)" was created using the ConceptDraw PRO diagramming and vector drawing software extended with the Bar Graphs solution from the Graphs and Charts area of ConceptDraw Solution Park.
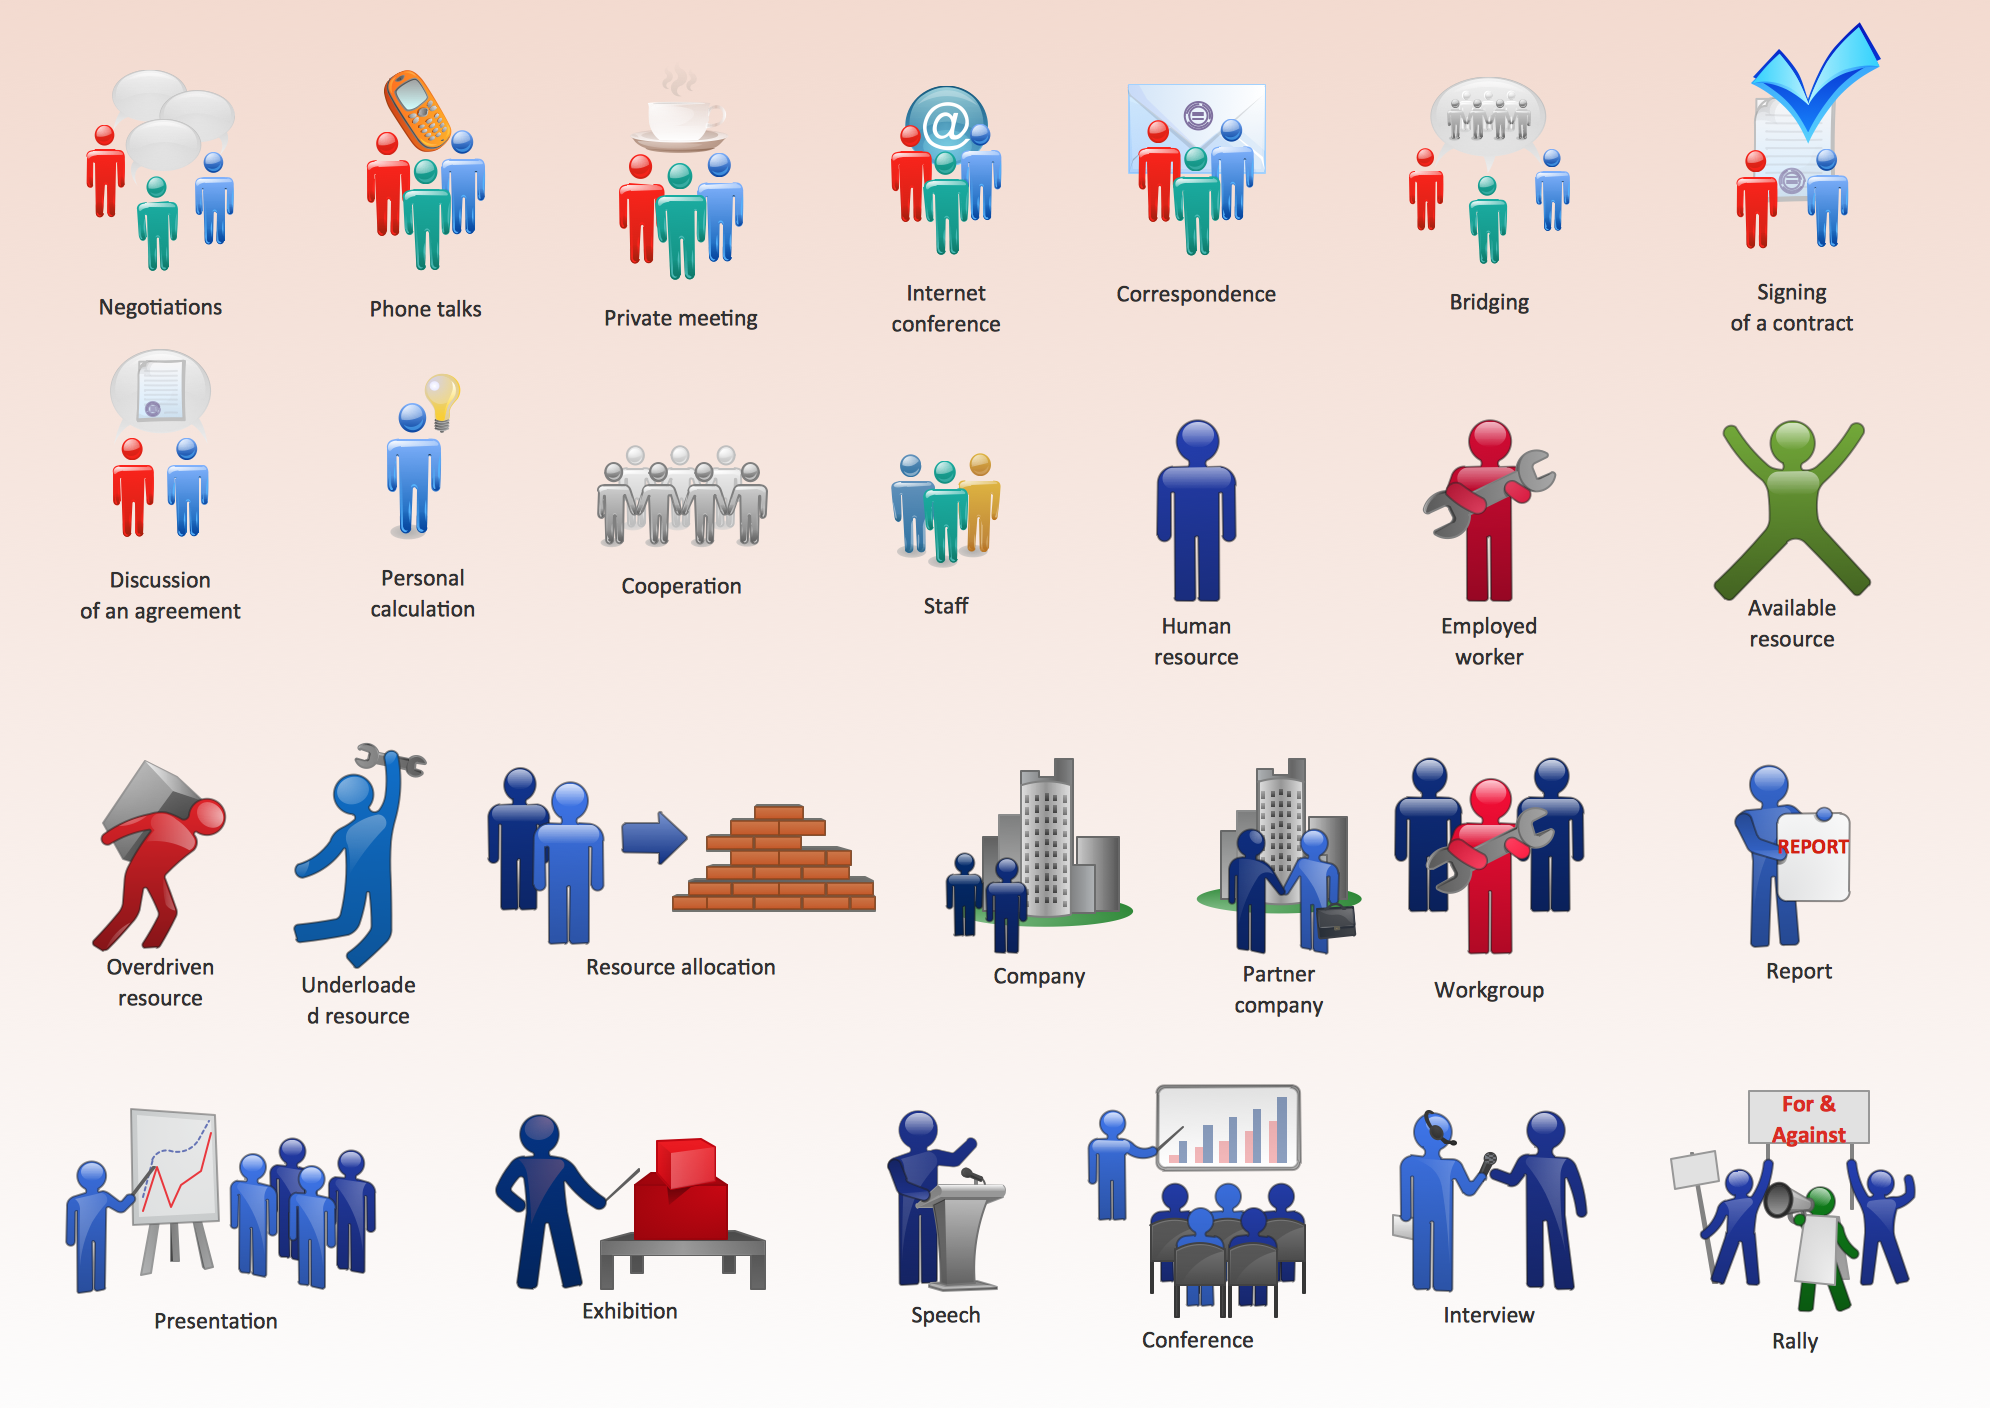
 People
This solution extends ConceptDraw PRO software with samples, templates and libraries of vector clipart for drawing the People illustrations. Use it to make professional-looking documents, presentations and websites illustrated with color scalable vector c
Geo Map - South America - Haiti
Haiti, officially the Republic of Haiti, is a Caribbean country.The vector stencils library Haiti contains contours for ConceptDraw PRO diagramming and vector drawing software. This library is contained in the Continent Maps solution from Maps area of ConceptDraw Solution Park.
Transportation Infographics
ConceptDraw is a visualization Software for making transportation infographics. Infographics design vector elements and vector graphics which will surely help you in your design process.Cisco People. Cisco icons, shapes, stencils and symbols
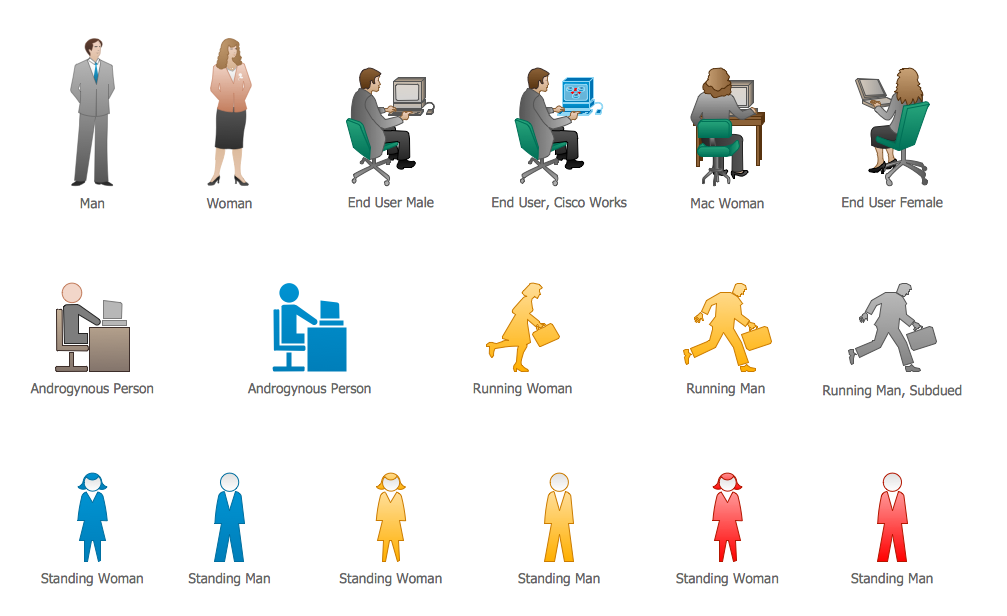
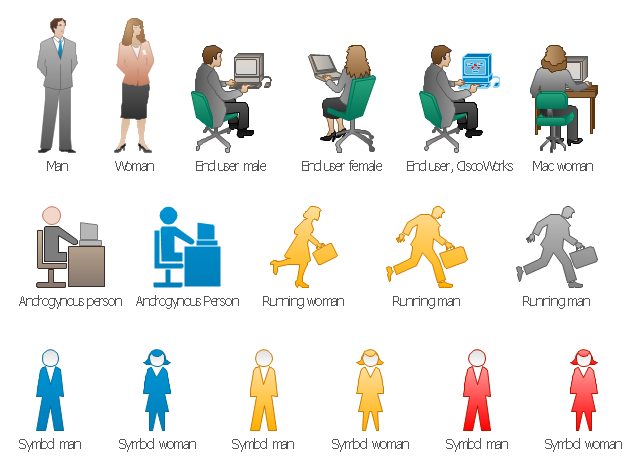
The ConceptDraw vector stencils library Cisco People contains symbols for drawing the computer network diagrams.Vector stencils library "Cisco People" contains 17 pictogram symbols and clipart for drawing the computer network diagrams using the ConceptDraw PRO diagramming and vector drawing software.
Subway infographic design elements - software tools
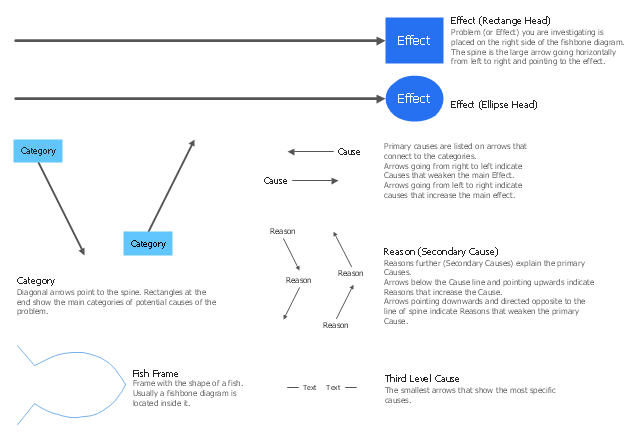
Subway infographic design elements of MetroMap and ConceptDraw software tools.The library of vector stencils "Fishbone diagrams" contains 13 symbols for drawing the Ishikawa diagrams using the ConceptDraw PRO diagramming and vector drawing software.
"Ishikawa diagrams were popularized by Kaoru Ishikawa in the 1960s, who pioneered quality management processes in the Kawasaki shipyards, and in the process became one of the founding fathers of modern management.
The basic concept was first used in the 1920s, and is considered one of the seven basic tools of quality control. It is known as a fishbone diagram because of its shape, similar to the side view of a fish skeleton." [Ishikawa diagram. Wikipedia]
"The Seven Basic Tools of Quality is a designation given to a fixed set of graphical techniques identified as being most helpful in troubleshooting issues related to quality. They are called basic because they are suitable for people with little formal training in statistics and because they can be used to solve the vast majority of quality-related issues.
The seven tools are:
(1) Cause-and-effect diagram (also known as the "fishbone" or Ishikawa diagram);
(2) Check sheet;
(3) Control chart;
(4) Histogram;
(5) Pareto chart;
(6) Scatter diagram;
(7) Stratification (alternately, flow chart or run chart)." [Seven Basic Tools of Quality. Wikipedia]
The example "Design elements - Fishbone diagram" is included in the Fishbone Diagrams solution from the Management area of ConceptDraw Solution Park.
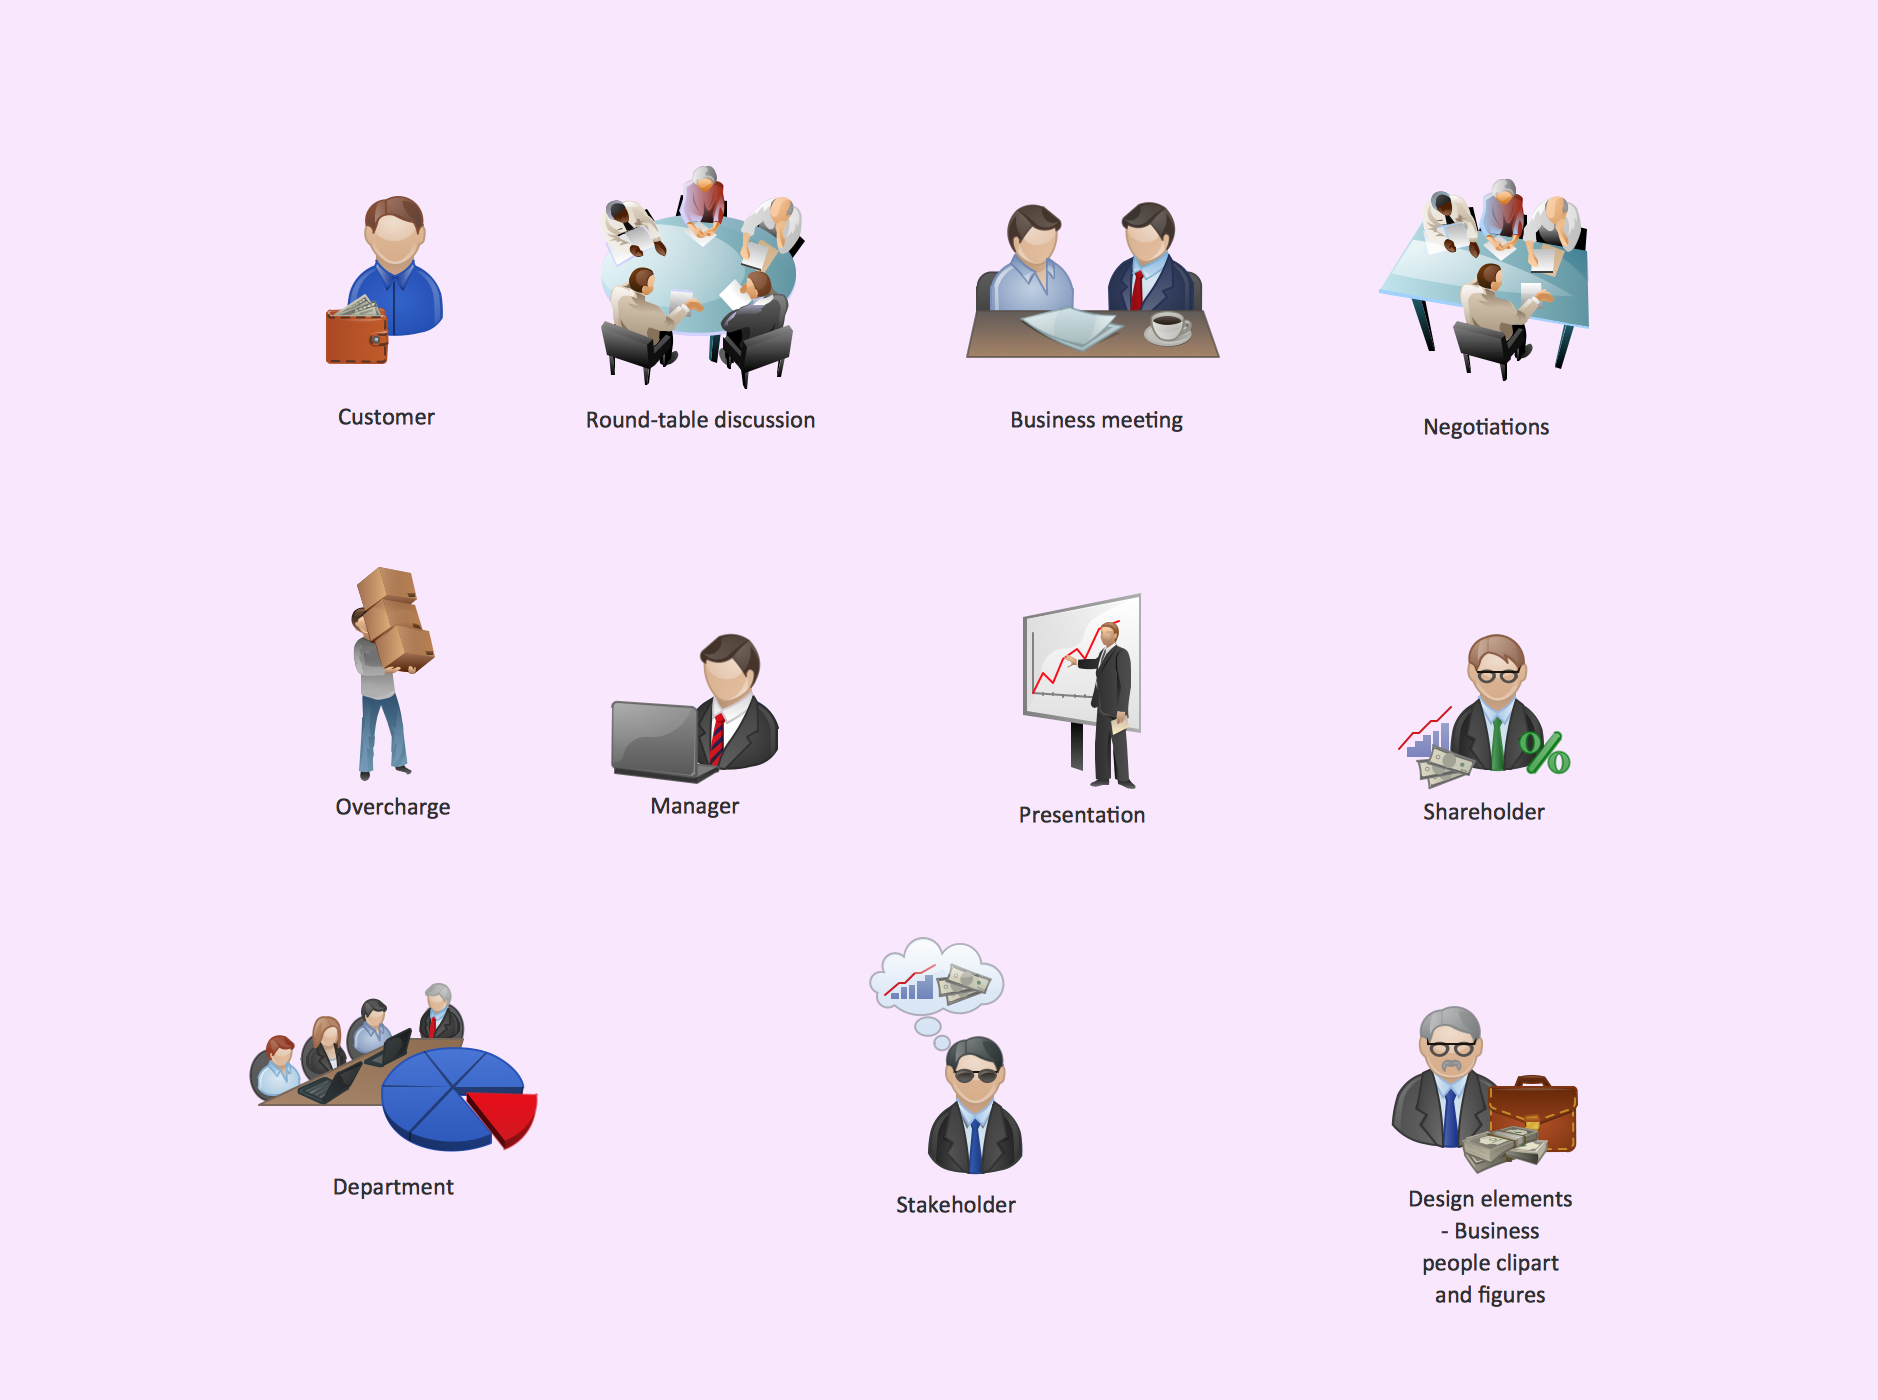
The vector stencils library "Business people pictograms" contains 14 icons of business people.
Use it to draw your pictorial infographics.
The example "Business people pictograms - Vector stencils library" was created using the ConceptDraw PRO diagramming and vector drawing software extended with the Pictorial infographics solution from the area "What is infographics" in ConceptDraw Solution Park.
The vector stencils library "People" contains 49 people clipart images and figures you can use in your presentations, illustrations and infographics.
"Clip art, in the graphic arts, refers to pre-made images used to illustrate any medium. Today, clip art is used extensively in both personal and commercial projects, ranging from home-printed greeting cards to commercial candles. Clip art comes in many forms, both electronic and printed. However, most clip art today is created, distributed, and used in an electronic form. Since its inception, clip art has evolved to include a wide variety of content, file formats, illustration styles, and licensing restrictions. Clip art is generally composed exclusively of illustrations (created by hand or by computer software), and does not include stock photography." [Clip art. Wikipedia]
The clip art example "People - Vector stencils library" was created using the ConceptDraw PRO diagramming and vector drawing software extended with the People solution from the Illustration area of ConceptDraw Solution Park.
www.conceptdraw.com/ solution-park/ illustrations-people
Business People Clipart
Business People Clipart - Business and Finance solution from Illustration area of ConceptDraw Solution Park.Use it to quick draw illustrations, diagrams and infographics for your business documents, presentations and websites.
The vector stencils library Business People Clipart includes 12 images.
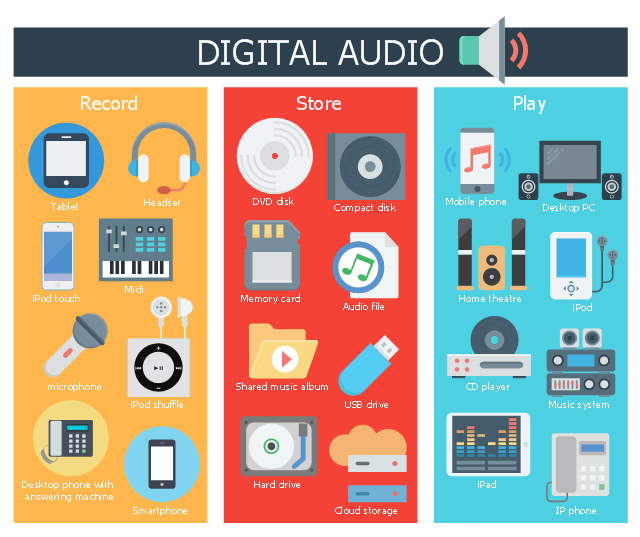
The infographics example "How and where do people listen to music" illustrates 2010 data: 20% - mobile, 39% - PC, 76% - car, and 79% - living room.
The infographics example "How and where do people listen to music" was created using ConceptDraw PRO diagramming and vector drawing software extended with the Audio, Video, Media solution from the Illustration area of ConceptDraw Solution Park.
The infographics example "How and where do people listen to music" was created using ConceptDraw PRO diagramming and vector drawing software extended with the Audio, Video, Media solution from the Illustration area of ConceptDraw Solution Park.
Business People Figures
Nowdays business people’s figures are most favourite vector illustrations among presenters and designers. It is easy to make them and use, but they can make your graphics look really good looking & eye catching.Just check ConceptDraw business perople figusers pictures, you will see all kinds of silhouetes: Staff, Employed workers, Persons and Groups symbols.
Best popular vector pictures are: men, dancing people, business man.
Use human contours wise and it will help you to tell main idea of your design message.
The vector stencils library "Cisco people" contains 17 pictogram symbols and clipart icons of people: Man, Woman, End user male and female, End user Cisco works, Mac woman, Androgynous person, Running woman and man, Symbols men and women.
Create the computer network diagrams using the ConceptDraw PRO diagramming and vector drawing software with the design elements library "Cisco people".
The example "Design elements - Cisco people" is included in the Cisco Network Diagrams solution from the Computer and Networks area of ConceptDraw Solution Park.
The vector stencils library "People pictograms" contains 20 icons of men and women symbols. Use it to draw your pictorial infograms. The example "People pictograms - Vector stencils library" was created using the ConceptDraw PRO diagramming and vector drawing software extended with the Pictorial infographics solution from the area "What is infographics" in ConceptDraw Solution Park.
- Nitrate concentration in Community Water Systems (CWS) - Double ...
- Fishbone Diagram | Business Productivity Diagramming ...
- Spatial infographics Design Elements: Transport Map ...
- Design elements - Fishbone diagram | Total Quality Management ...
- Fishbone diagram - HAN project | Nitrate concentration in ...
- Cause and effect diagram - Increase in productivity | Design ...
- Computers and Communications | What are Infographic Area | Idea ...
- Australia Map Example
- Design Pictorial Infographics. Design Infographics | How to Design a ...
- How to Create Management Infographics Using ConceptDraw PRO ...
- Concept Maps | Education | What are Infographic Area | Vector ...
- Marketing Plan Infographic | How to Create a Powerful Infographic ...
- People | Cisco People . Cisco icons, shapes, stencils and symbols ...
- Map Infographic Design | Map Infographic Maker | Spatial ...
- Spatial infographics Design Elements: Continental Map | Map ...
- Ishikawa Diagram | How to Draw a Fishbone Diagram with ...
- Spatial infographics Design Elements: Continental Map ...
- Subway infographic design elements - software tools | Infographic ...
- Fishbone Diagram | Seven Basic Tools of Quality - Fishbone ...
- Design elements - People
---double-bar-chart.png--diagram-flowchart-example.png)


