How to Create a Pie Chart
Create a Pie Chart with ConceptDraw software quickly and easily. The simple tutorial helps you learn how to create a pie chart.Onion Diagram Process Design
Onion diagram is a type of circular diagram that consists of the core circle representing the product/solution and concentric circles around it, which dependent on the core and look like the cross sections of onion. ConceptDraw DIAGRAM diagramming and vector drawing software supplied with Stakeholder Onion Diagrams Solution from the Management Area of ConceptDraw Solution Park is an ideal software for effective Onion diagram process design.HelpDesk
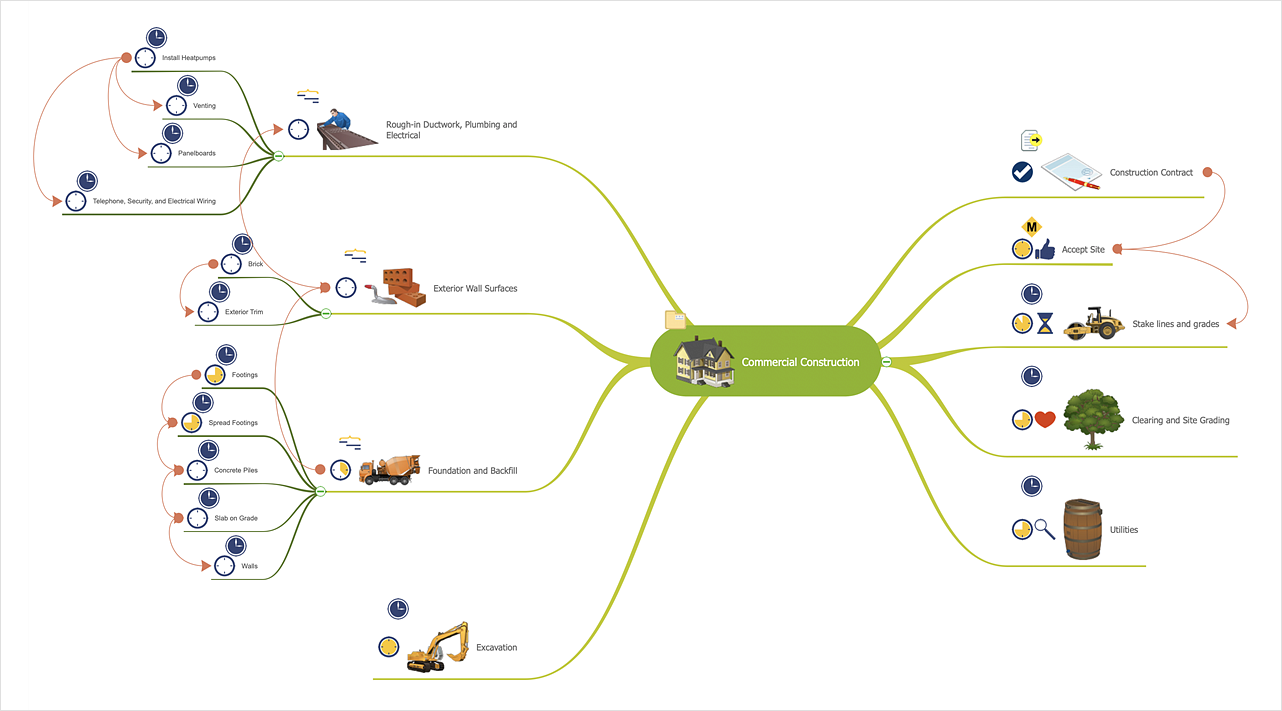
How to Create an Effective Mind Map Using Topic Types
Increase mind map effectiveness using Topic Types functionality, delivered with ConceptDraw MINDMAP. Each Topic Type icon supports a specific set of information relating to the contents of the topic. Different Topics Types icons set are supplied with the MINDMAP application and the solutions that you can download from Solution Park.
 Target and Circular Diagrams
This solution extends ConceptDraw DIAGRAM software with samples, templates and library of design elements for drawing the Target and Circular Diagrams.
Bar Chart Software
The best bar chart software ever is ConceptDraw. ConceptDraw bar chart software provides an interactive bar charting tool and complete set of predesigned bar chart objects.Flow Chart Symbols
ConceptDraw DIAGRAM software extended with Flowcharts Solution from the "Diagrams" Area is a powerful software that will help you design the flowcharts for any business and technical processes, and software algorithms thanks to the predesigned flow chart symbols. Flowcharts solution offers 2 libraries with large collection of vector flow chart symbols: Flowchart Library, Flowcharts Rapid Draw Library that you can use to create your flowcharts quick and easy. Flowchart Solution is number of diagraming stencils including special set of flow chart symbols such as: terminator, process, decision which indicates a decision points between two or more paths in a flowchart, symbol of delay. Major symbols includes symbol of data, document or multiple documents, subroutine, preparation for processing of documents. Also includes symbols: display, manual input, manual loop, loop limit, stored data,connectors and suming junctions, sort and merge operations, symbols of database and internal storSwim Lane Diagrams
Swim Lane Diagrams are the kind of process flow diagrams and effective tool for documenting the business processes required for any business company for its productive work, for easy defining the weak points, reasons of defects, or delays during the process. Swim Lane Diagram is based on the IDEF3 standard and was developed primarily for using in projecting. Its name derives from the use of horizontal or vertical lanes. The blocks that denote the parts of the processes are arranged within definite lanes according to the belonging to responsible worker. So the process of any complexity is visually divided into the parts and represented with indication the responsibility for execution of each part. This significantly facilitates the comprehension of its work. Use the ConceptDraw DIAGRAM software and predesigned vector objects from the Swim Lanes library of Business Process Mapping Solution included to ConceptDraw Solution Park to easy develop Swim Lanes Flowcharts and Diagrams, for modeling and documenting the business processes in a simple and visual graphic form.
 Seven Basic Tools of Quality
Manage quality control in the workplace, using fishbone diagrams, flowcharts, Pareto charts and histograms, provided by the Seven Basic Tools of Quality solution.
- Percentage Chart Png
- National Preparedness Cycle - Arrow ring chart | Circular diagrams ...
- Atmosphere air composition | Percentage Pie Chart. Pie Chart ...
- Pie Chart Examples and Templates | Donut Chart Templates ...
- Pie Chart Software | Exploded pie chart ( percentage ) - Template ...
- Flowchart design. Flowchart symbols, shapes, stencils and icons ...
- Pie Chart Software | How to Draw a Pie Chart Using ConceptDraw ...
- Arrow circle chart
- Basic Flowchart Symbols and Meaning | Circle Spoke Diagram ...
- Chart Examples | Line Chart Examples | Bar Graphs | Percentage Vs ...
- Arrow circle chart - Template | Pie Chart Examples and Templates ...
- Pie Chart Examples and Templates | Donut Chart Templates ...
- Pie Chart Software | How to Draw a Pie Chart Using ConceptDraw ...
- Flowchart design. Flowchart symbols, shapes, stencils and icons ...
- Arrow circle chart - Template | Basic Flowchart Symbols and ...
- How to Draw the Different Types of Pie Charts | Ring chart ...
- Elements location of a welding symbol | Cisco Network Design ...
- Circular Chart
- Atmosphere air composition | Percentage Pie Chart. Pie Chart ...
- Donut Chart


