Performance Indicators
ConceptDraw PRO diagramming and vector drawing software offers the useful tools of the Sales Dashboard solution from the Marketing area for easy creating professional looking live dashboards which allow to track the business sales activity and progress thanks to representing the Key Performance Indicators (KPIs) on them.Constant improvement of key performance indicators
There are available tool to lend a fresh look to quality procedures - ConceptDraw MINDMAP.TQM Diagram — Professional Total Quality Management
The Total Quality Management Diagram solution helps you and your organization visualize business and industrial processes. Create Total Quality Management diagrams for business process with ConceptDraw software.What is a Quality Management
Successful quality management implemented in a company of any size is a critical component of a company organization.Quality Mind Maps - samples and templates
Use samples and templates to describe your own quality processes, brainstorm, and structure quality issues.SWOT Analysis
The success of the company depends on how successfully it is able to react on different outside influences. When analyzing the external situation, it is necessary to identify the factors most significant on a specified period of time. An interrelated consideration of these factors with the company's possibilities allows to solve effectively appearing problems. One of the most common methods of assessment together internal and external factors influencing the company's development is a SWOT analysis. SWOT analysis (acronym composed of the first letters of the words: strength, weakness, opportunities, threats) is one of the most common and effective types of analysis in marketing and marketing researches. It allows to identify and structure the strengths and weaknesses of an enterprise, as well as potential opportunities and threats of the market, to make conclusion in which direction a given organization needs to develop its business and to formulate the organization's strategy. Use the ConceptDraw MINDMAP software and offered SWOT analysis templates for easy holding SWOT analysis for your company. This Mind Map displays the SWOT analysis for a company and variety of performance measures that influence its work.Quality Management Teams
ConceptDraw MINDMAP with Quality mindmaps solution as a demonstration of the creative approach to quality management in daily work of quality management team.
 Meter Dashboard
Meter dashboard solution extends ConceptDraw PRO software with templates, samples and vector stencils library with meter indicators for drawing visual dashboards showing quantitative data.
Process Flowchart
The main reason of using Process Flowchart or PFD is to show relations between major parts of the system. Process Flowcharts are used in process engineering and chemical industry where there is a requirement of depicting relationships between major components only and not include minor parts. Process Flowcharts for single unit or multiple units differ in their structure and implementation. ConceptDraw PRO is Professional business process mapping software for making Process flowcharts, Process flow diagram, Workflow diagram, flowcharts and technical illustrations for business documents and also comprehensive visio for mac application. Easier define and document basic work and data flows, financial, production and quality management processes to increase efficiency of your business with ConcepDraw PRO. Business process mapping software with Flowchart Maker ConceptDraw PRO includes extensive drawing tools, rich examples and templates, process flowchart symbols and shape libraries, smart connectors that allow you create the flowcharts of complex processes, process flow diagrams, procedures and information exchange. Process Flowchart Solution is project management workflow tools which is part ConceptDraw Project marketing project management software. Drawing charts, diagrams, and network layouts has long been the monopoly of Microsoft Visio, making Mac users to struggle when needing such visio alternative like visio for mac, it requires only to view features, make a minor edit to, or print a diagram or chart. Thankfully to MS Visio alternative like ConceptDraw PRO software, this is cross-platform charting and business process management tool, now visio alternative for making sort of visio diagram is not a problem anymore however many people still name it business process visio tools.
Lean Six Sigma Diagram Software
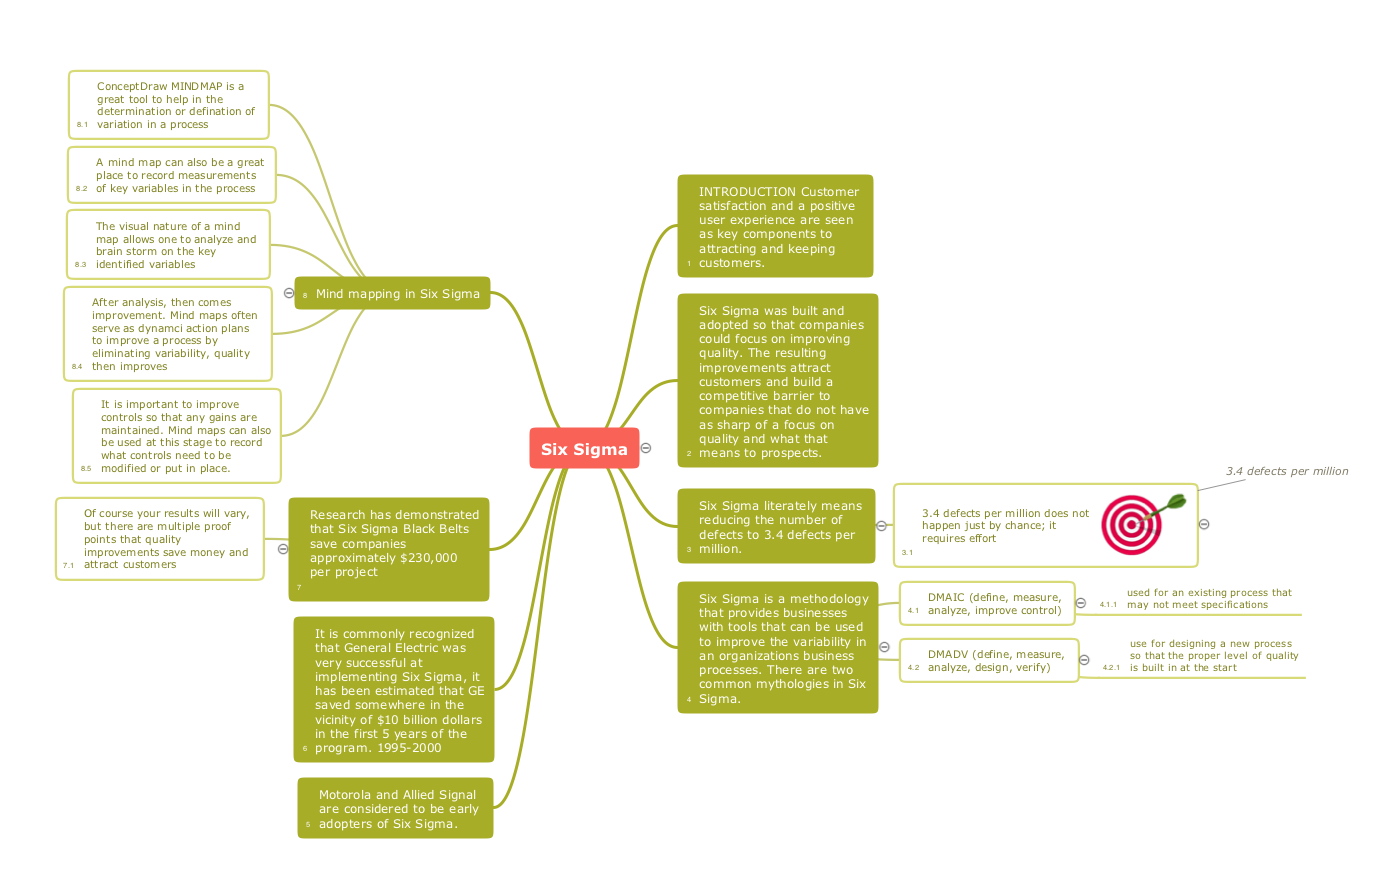
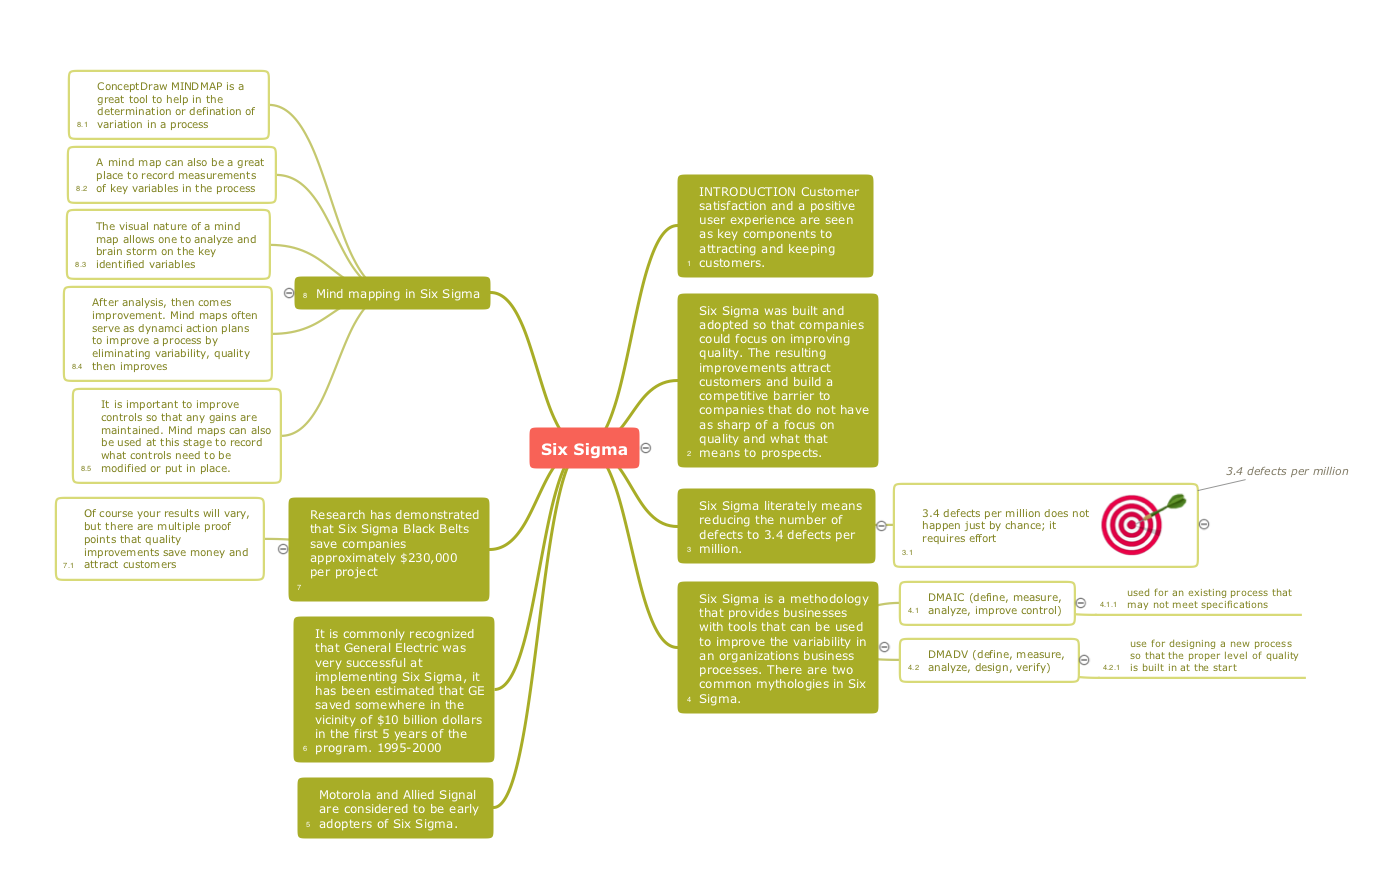
Lean Six Sigma (LSS) is a well-known in all over the world methodology of quality improvement and business perfection. ConceptDraw PRO diagramming and vector drawing software is a powerful Lean Six Sigma Diagram Software thanks to the included Value Stream Mapping solution from the Quality Management Area of ConceptDraw Solution Park.
 Quality Mind Map
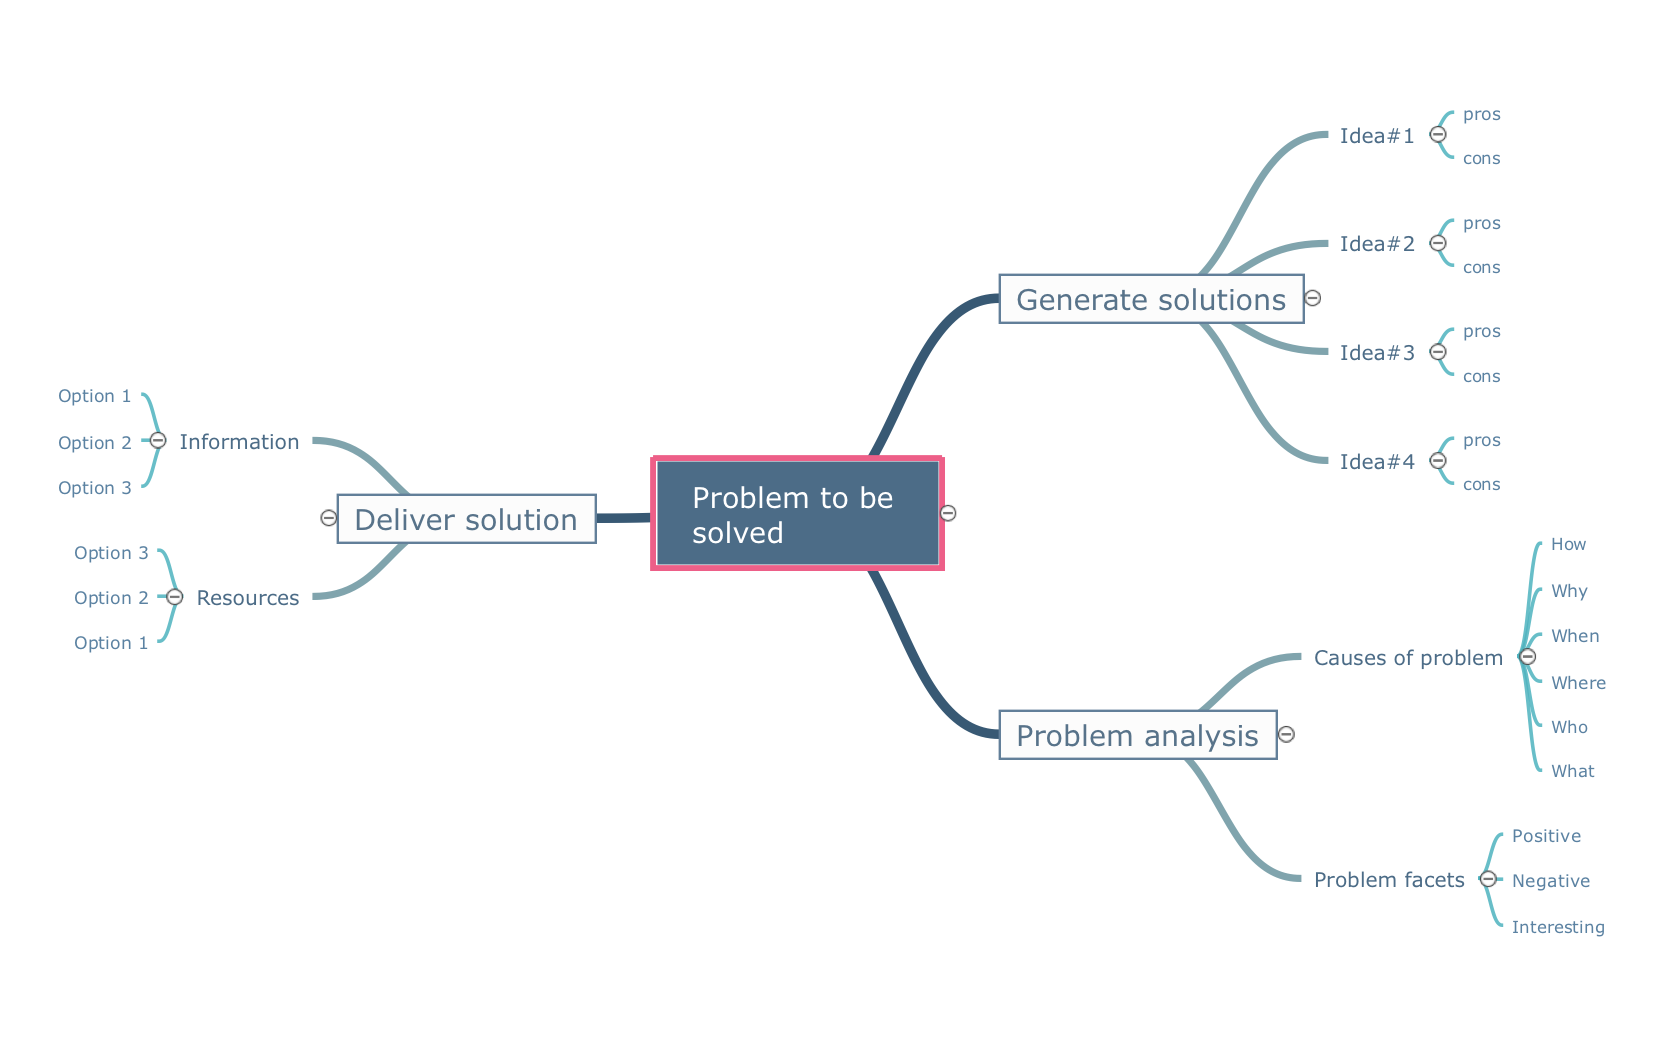
This solution extends ConceptDraw MINDMAP software with Quality Management Mind Maps (Presentations, Meeting Agendas, Problem to be solved).
SWOT Analysis Tool for Small Business
SWOT analysis is effective method of making the plan to evaluate the Strengths, Weaknesses, Opportunities, and Threats involved in a project. SWOT analysis includes the specifying project objectives and attentive identifying the internal and external causes for accomplishing the main project goals. It is actively used in large and small business project management for effective and clear identifying the critical factors. SWOT and TOWS Matrix Diagrams solution is included to ConceptDraw Solution Park and contains the high-quality analysis tools. This graphical solution turns the ConceptDraw PRO software in an excellent marketing management and advertising agency software, the best SWOT analysis tool for small business or large, as you like and need. Included graphic tools, visual and project planning components make it the best marketing project management software for marketing project planning and for making marketing presentations. Use the ConceptDraw PRO to create professional and well-designed SWOT matrices in minutes.
 Sales Dashboard
Sales Dashboard solution extends ConceptDraw PRO software with templates, samples and library of vector stencils for drawing the visual dashboards of sale metrics and key performance indicators (KPI).
 Circular Arrows Diagrams
Circular Arrows Diagrams solution extends ConceptDraw PRO v10 with extensive drawing tools, predesigned samples, Circular flow diagram template for quick start, and a library of ready circular arrow vector stencils for drawing Circular Arrow Diagrams, Segmented Cycle Diagrams, and Circular Flow Diagrams. The elements in this solution help managers, analysts, business advisers, marketing experts, scientists, lecturers, and other knowledge workers in their daily work.
- Status Dashboard | TQM Diagram — Professional Total Quality ...
- Performance Indicators | Constant improvement of key performance ...
- Constant improvement of key performance indicators | TQM Diagram ...
- Performance Indicators | Constant improvement of key performance ...
- Process Flowchart | Quality Improvement | TQM Software — Build ...
- KPIs and Metrics | Business Intelligence Dashboard | The Facts and ...
- Cafe performance metrics vs. air temperature - Visual dashboard ...
- Strategy Map | Competitor Analysis | TQM Diagram Tool | Swot Metrics
- Performance Indicators | PM Dashboards | Design elements - Sales ...
- Performance Indicators | Design elements - Composition charts and ...
- Design elements - Sales KPIs and metrics | Performance Indicators ...
- Performance Indicators | Constant improvement of key performance ...
- Total Quality Management TQM Diagrams | Identifying Quality ...
- Performance Indicators | The Facts and KPIs | KPIs and Metrics ...
- SWOT Analysis | Management Tools — Total Quality Management ...
- Organizational Structure Total Quality Management | Mind Mapping ...
- Performance Indicators | Design elements - Sales KPIs and metrics ...
- Performance Indicators | The Facts and KPIs | Strategy Map | Data ...
- TQM Diagram Tool | SWOT Analysis Software | Total Quality ...


