HelpDesk
How To Create a PERT Chart
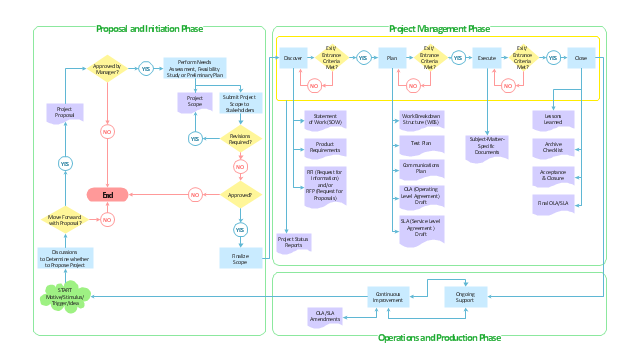
Project Evaluation and Review Technique (PERT) is a method of project tasks evaluation and analysis. PERT - is a method of analyzing the tasks required to complete the project. It includes analysis of the time required to complete each task, as well as the determination of the time required to carry out the whole project. PERT was developed to facilitate the planning of huge and complex projects. PERT is used for very large, complex, and non-standard projects. Technology implies the presence of uncertainty, making it possible to develop a schedule of the project without a precise information on details and time required for all of its components. The most popular part of PERT is a method of the critical path, based on the construction of the network schedule (PERT network diagram). ConceptDraw Office delivers you the best way to create PERT chart for your project using compatibility between ConceptDraw PROJECT and ConceptDraw PRO.HelpDesk
How to Create a Bar Chart in ConceptDraw PRO
Bar charts (bar graphs) are diagrams displaying data as horizontal or vertical bars of certain heights. Bar charts are widely used to show and compare the values of the same parameters for different data groups. The bar graph can be vertical or horizontal. This depends on the amount of categories. There are many methods in which bar graph can be built and this makes it a very often used chart type. Usually, a bar chart is created so that the bars are placed vertically. Such arrangement means that the bar's height value is proportional to the category value. Nevertheless, a bar chart can be also drawn horizontally. This means that the longer the bar, the bigger the category. Thus, a bar chart is a good way to present the relative values of different measured items. The ConceptDraw Bar Graphs solution allows you to draw a bar chart quickly using a vector library, containing the set of various bar charts objects.HelpDesk
How to Change the Working Time in a Project
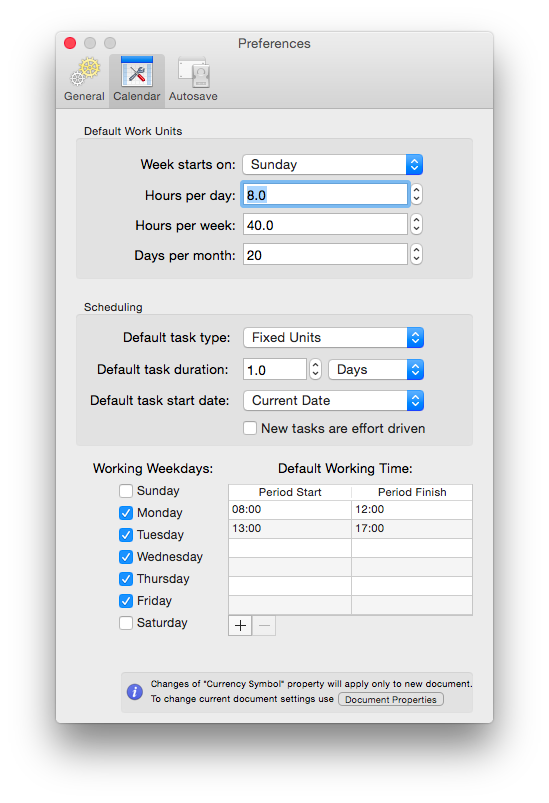
Project calendar determines working and non-working time of the project. It is used as a base to the project schedule development. There two types of project calendars: Project Calendar - which sets the working time for the whole project; and the Resource Calendar- which sets the working time of the particular project resource. The following article describes how to change the default calendar in ConceptDraw PROJECT.
 Line Graphs
How to draw a Line Graph with ease? The Line Graphs solution extends the capabilities of ConceptDraw PRO v10 with professionally designed templates, samples, and a library of vector stencils for drawing perfect Line Graphs.
 Area Charts
Area Charts are used to display the cumulative totals over time using numbers or percentages; or to show trends over time among related attributes. The Area Chart is effective when comparing two or more quantities. Each series of data is typically represented with a different color, the use of color transparency in an object’s transparency shows overlapped areas and smaller areas hidden behind larger areas.
HelpDesk
ConceptDraw Software Full Versions Free Download
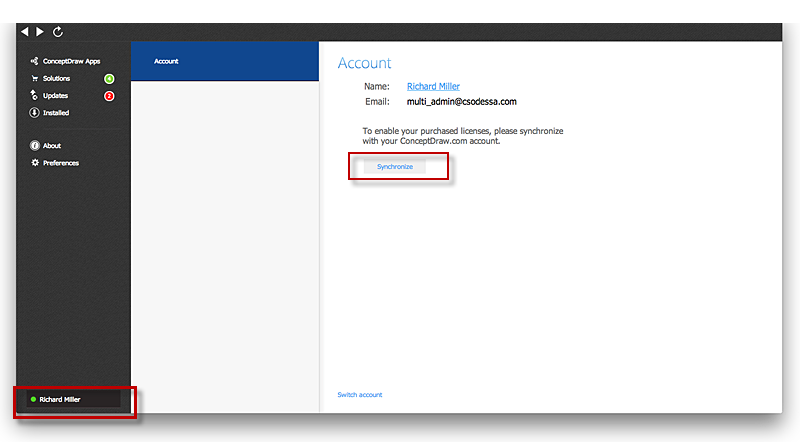
ConceptDraw software provides registered users a 21 day trial period at no charge. It functions exactly as a fully licensed copy of the product does. Once you have activated your account you are then able to download and install ConceptDraw software as well, as solutions from Solution Park. Here is an instructions on how to download and try ConceptDraw products for free. For 21 days the trial functions exactly like the purchased product. There are no limitations to file size, how many times you can print, or any of the products functionality. After the trial period expires, you will be able to open ConceptDraw documents to view.
 Basic Area Charts
This solution extends the capabilities of ConceptDraw PRO v10.3.0 (or later) with templates, samples and a library of vector stencils for drawing Area Charts (area graphs) that visualize changes in values by filling in the area beneath the line connecting data points.
"Product life cycle is a business analysis that attempts to identify a set of common stages in the life of commercial products. In other words the 'Product Life cycle' PLC is used to map the lifespan of the product such as the stages through which a product goes during its lifespan. ...
The stages of a product's life cycle... :
1. INTRODUCTION... 2. GROWTH... 3. MATURITY... 4. DECLINE...
The product life cycle is an important concept in marketing. It includes four stages that a product goes through from when it was first thought of until it is eliminated from the industry. Not all products reach this final stage. Some continue to grow and others rise and fall." [Product lifecycle. Wikipedia]
The flow chart example "Product life cycle process" was created using the ConceptDraw PRO diagramming and vector drawing software extended with the Flowcharts solution from the area "What is a Diagram" of ConceptDraw Solution Park.
HelpDesk
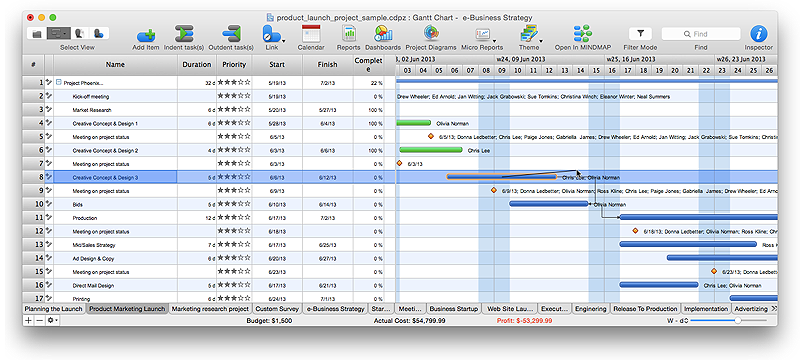
How to Shift Dates in ConceptDraw PROJECT
A way to shift all dates in a project a specified period, so you can use old project schedules as a template for new schedules- Concept Of Business Cycle With Diagram Wikipedia
- National Preparedness Cycle - Arrow ring chart | Program to Make ...
- Draw The Diagram Of Product Life Cycle
- How To Create a Flow Chart in ConceptDraw | ConceptDraw ...
- Project management life cycle - Flowchart | Program to Make Flow ...
- Life Cycle Flow Chart
- Chart Of A Smaple Product Life Cycle
- Creatively Draw A Diagram That Indicates The Human Life Cycle
- Concept Maps | Basic Diagramming | How To Create a Flow Chart in ...
- Program to Make Flow Chart | Drawing Illustration | Draw ...
- Process Flowchart | Flow chart Example. Warehouse Flowchart ...
- ConceptDraw Office: What Our Users Say
- What Program Concept Product
- Draw And Label A Product Life Cycle Diagram
- Project Cycle Chart
- Product life cycle process - Flowchart | Use the Best FlowChart Tool ...
- Vector Cycle Arrow Diagram
- The Best Flowchart Software Available | Concept Mapping ...
- How To Create a Flow Chart in ConceptDraw | Concept Maps | How ...
- Program to Make Flow Chart | Innovation life cycle - Arrow loop ...


