HelpDesk
How To Create a PERT Chart Using PM Easy Solution
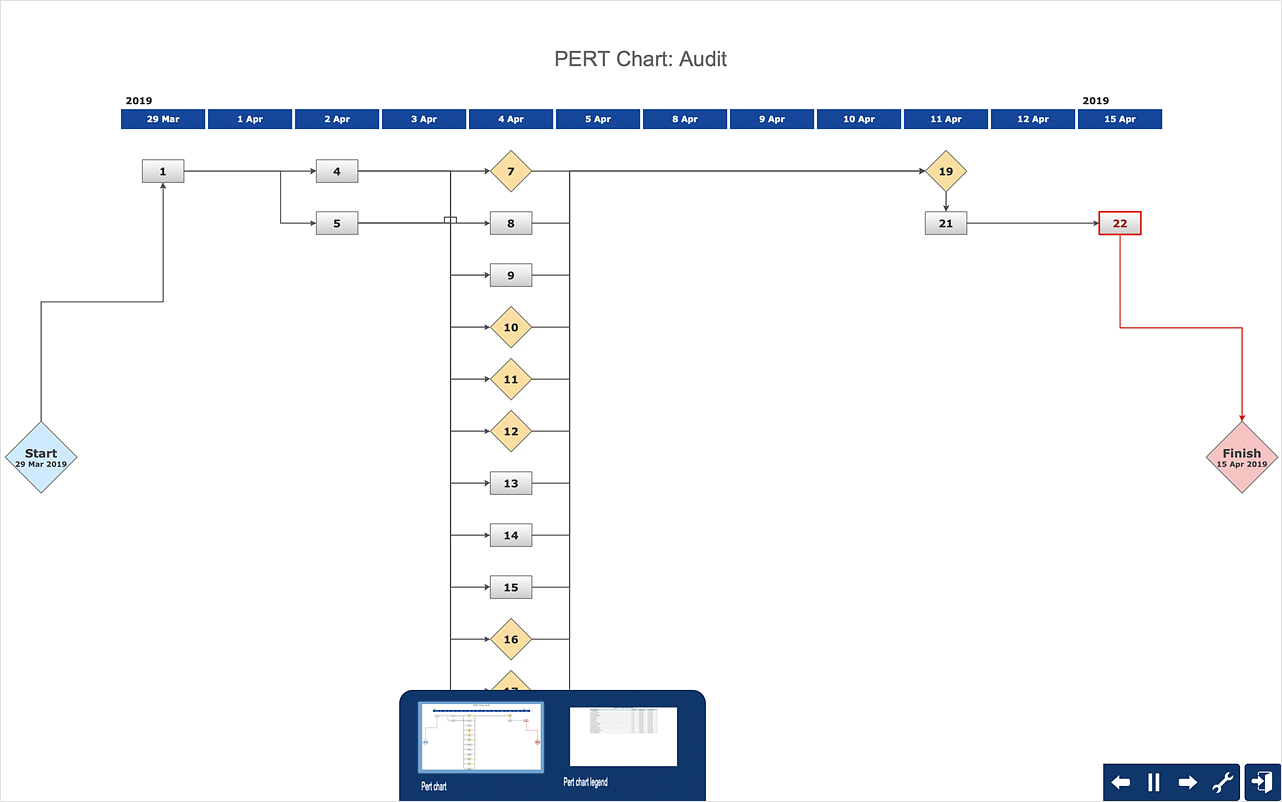
Project Evaluation and Review Technique (PERT) is a method of project tasks evaluation and analysis. PERT - is a method of analyzing the tasks required to complete the project. It includes analysis of the time required to complete each task, as well as the determination of the time required to carry out the whole project. PERT was developed to facilitate the planning of huge and complex projects. PERT is used for very large, complex, and non-standard projects. Technology implies the presence of uncertainty, making it possible to develop a schedule of the project without a precise information on details and time required for all of its components. The most popular part of PERT is a method of the critical path, based on the construction of the network schedule (PERT network diagram). ConceptDraw Office delivers you the best way to create PERT chart for your project using compatibility between ConceptDraw PROJECT and ConceptDraw DIAGRAM.Example of DFD for Online Store (Data Flow Diagram)
Data Flow Diagram (DFD) is a methodology of graphical structural analysis and information systems design, which describes the sources external in respect to the system, recipients of data, logical functions, data flows and data stores that are accessed. DFDs allow to identify relationships between various system's components and are effectively used in business analysis and information systems analysis. They are useful for system’s high-level details modeling, to show how the input data are transformed to output results via the sequence of functional transformations. For description of DFD diagrams are uses two notations — Yourdon and Gane-Sarson, which differ in syntax. Online Store DFD example illustrates the Data Flow Diagram for online store, the interactions between Customers, Visitors, Sellers, depicts User databases and the flows of Website Information. ConceptDraw DIAGRAM enhanced with Data Flow Diagrams solution lets you to draw clear and simple example of DFD for Online Store using special libraries of predesigned DFD symbols.
 ConceptDraw Solution Park
ConceptDraw Solution Park collects graphic extensions, examples and learning materials
- UML Component Diagram Example - Online Shopping | How To ...
- Example of DFD for Online Store (Data Flow Diagram ). DFD ...
- UML Component Diagram Example - Online Shopping | State ...
- Example of DFD for Online Store (Data Flow Diagram ). DFD ...
- Flow Chart Diagram Online Shopping Examples
- Example of DFD for Online Store (Data Flow Diagram ). DFD ...
- UML Component Diagram Example - Online Shopping | UML ...
- UML Component Diagram Example - Online Shopping | UML Tool ...
- How To Draw Flowchart For Online Shopping Site
- UML Component Diagram Example - Online Shopping | UML Tool ...
- UML Class Diagram Example - Medical Shop | UML Component ...
- Online store social media response flowchart | Visual shopping ...
- UML Component Diagram Example - Online Shopping | State ...
- UML Component Diagram Example - Online Shopping | State ...
- Example of DFD for Online Store (Data Flow Diagram ). DFD ...
- Online Diagram Tool | UML Component Diagram Example - Online ...
- Explanation Of Online Shoping Flow Chart
- Online Shopping Software Engineering
- Online shop - Concept map
- Online Shopping Software Engineering Project

