HelpDesk
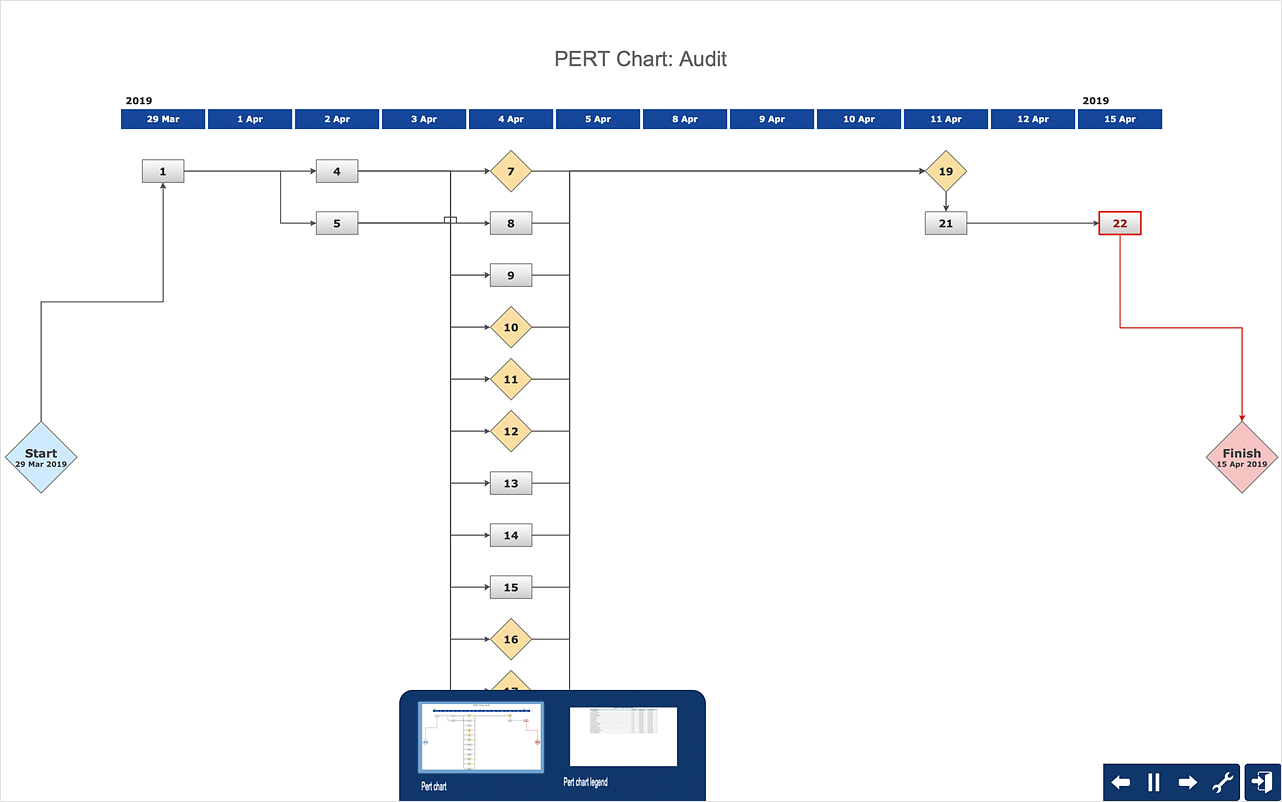
How To Create a PERT Chart Using PM Easy Solution
Project Evaluation and Review Technique (PERT) is a method of project tasks evaluation and analysis. PERT - is a method of analyzing the tasks required to complete the project. It includes analysis of the time required to complete each task, as well as the determination of the time required to carry out the whole project. PERT was developed to facilitate the planning of huge and complex projects. PERT is used for very large, complex, and non-standard projects. Technology implies the presence of uncertainty, making it possible to develop a schedule of the project without a precise information on details and time required for all of its components. The most popular part of PERT is a method of the critical path, based on the construction of the network schedule (PERT network diagram). ConceptDraw Office delivers you the best way to create PERT chart for your project using compatibility between ConceptDraw PROJECT and ConceptDraw DIAGRAM.Making Diagrams Has Never Been Easier
The innovative ConceptDraw DIAGRAM is a powerful drawing tool that changes the way diagrams are produced. While making diagrams has never been easier. This is more than enough versatility to draw any type of diagram with any degree of complexity.Network Diagramming Software for Design Basic Network Diagrams
ConceptDraw DIAGRAM is perfect for software designers and software developers who need to draw Basic Network Diagrams.
Garrett IA Diagrams with ConceptDraw DIAGRAM
Garrett IA diagrams are used at development of Internet-resources, in particulars at projecting of interactions of web-resource elements. The diagram of information architecture of the web resource which is constructed correctly with necessary details presents to developers the resource in comprehensible and visual way.Business diagrams & Org Charts with ConceptDraw DIAGRAM
The business diagrams are in great demand, they describe the business processes, business tasks and activities which are executed to achieve specific organizational and business goals, increase productivity, reduce costs and errors. They let research and better understand the business processes. ConceptDraw DIAGRAM is a powerful professional cross-platform business graphics and business flowcharting tool which contains hundreds of built-in collections of task-specific vector stencils and templates. They will help you to visualize and structure information, create various Business flowcharts, maps and diagrams with minimal efforts, and add them to your documents and presentations to make them successful. Among them are Data flow diagrams, Organization charts, Business process workflow diagrams, Audit flowcharts, Cause and Effect diagrams, IDEF business process diagrams, Cross-functional flowcharts, PERT charts, Timeline diagrams, Calendars, Marketing diagrams, Pyramids, Target diagrams, Venn diagrams, Comparison charts, Analysis charts, Dashboards, and many more. Being a cross-platform application, ConceptDraw DIAGRAM is very secure, handy, free of bloatware and one of the best alternatives to Visio for Mac users.
Project — Working With Tasks
A full-featured project management solution with all the necessary functions right at your fingertips. Generates an extensive variety of reports on project and task statuses. These videos provide a series of lessons that will enhance the understanding of all our users, from people just starting out with the software, through to expert users.- Draw Gantt Chart For Development Of Library Information System
- Web Development Project Gun Chart
- Draw Ghatt Chart For Development Of Library Information System
- Activity Chart Of Software Development Examples
- Figure Of Gantt Chart For Development Of Librery Information System
- Website Development Gantt Chart
- Development Decision Diagram
- Gantt Chart Web Development Project
- Flowchart Examples Website Development Project
- Activity Network ( PERT ) Chart | Types of Flowchart - Overview ...
- Mind Map Website Development Gantt Chart
- Process Flowchart | Gantt chart examples | Program Evaluation and ...
- Gantt Chart Software | Seating Chart Template | Interior Design ...
- Gantt Chart For Software Development Sample
- Example Gantt Chart For Website Development Free Download
- System Development Gantt Chart
- Example Of Gantt Chart For System Development
- Project Execution Flow Diagram
- Personal Development Plan Gantt Chart
- Website Developer Chartbusiness Process Using Chart


_Win_Mac.png)


