HelpDesk
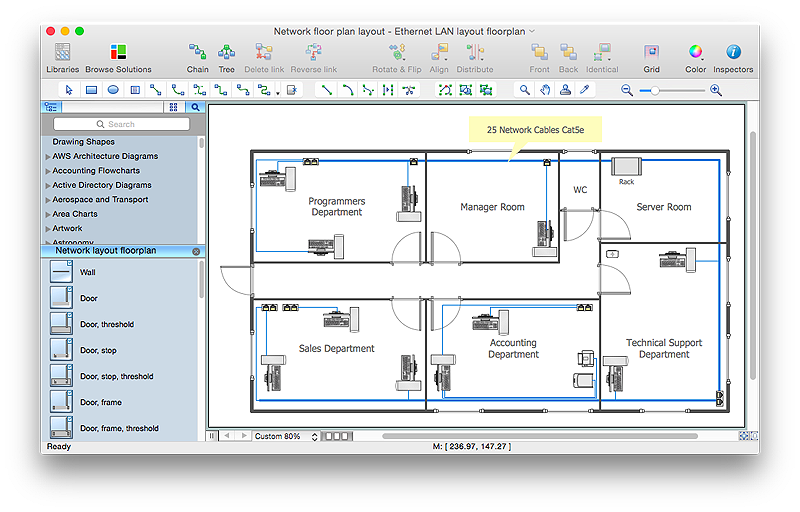
How to Create a Network Layout Floor Plan
With technology and market forces demanding ever quicker business response times, a well-structured computer network is the foundation of positive communication between employees, and with the wider world. When you walk into most modern work offices, there is a good chance you will be greeted by banks of computer screens and terminals, perhaps some sales points screens or server stacks, almost certainly routers and printers. A side effect of this amount of hardware is the amount of cabling necessary to connect these elements into an effective local area network (LAN). This is the idea behind a network layout plan - it can show how a network is connected, how data transfers between those connections, and give an overview of devices and hardware used in office. To create a practical computer network floor plan, the network administrator must adhere to the specified requirements and limitations of the office or building in which the LAN will operate - things such as hardware availability,
 Bar Graphs
The Bar Graphs solution enhances ConceptDraw PRO v10 functionality with templates, numerous professional-looking samples, and a library of vector stencils for drawing different types of Bar Graphs, such as Simple Bar Graph, Double Bar Graph, Divided Bar Graph, Horizontal Bar Graph, Vertical Bar Graph, and Column Bar Chart.
 Computer and Networks Area
The solutions from Computer and Networks Area of ConceptDraw Solution Park collect samples, templates and vector stencils libraries for drawing computer and network diagrams, schemes and technical drawings.
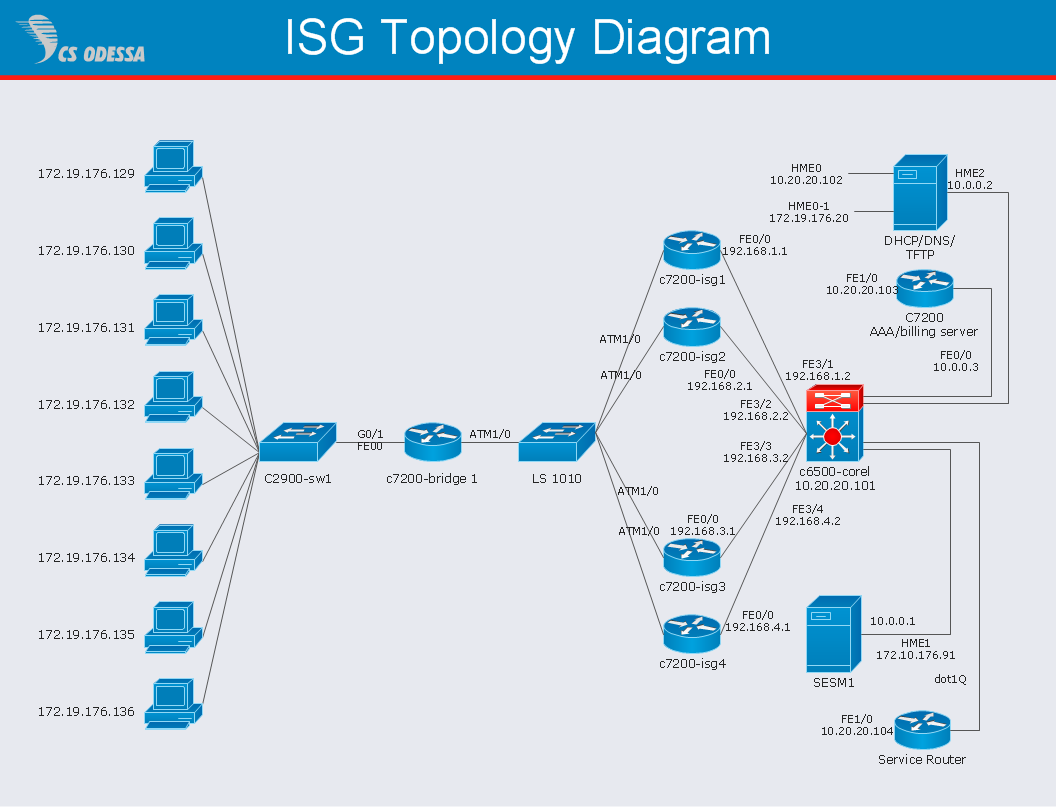
Network Diagram Software ISG Network Diagram
Drawing ISG Network Diagram using ConceptDraw PRO stencils
 Sales Flowcharts
The Sales Flowcharts solution lets you create and display sales process maps, sales process workflows, sales steps, the sales process, and anything else involving sales process management.
 Fishbone Diagrams
The Fishbone Diagrams solution extends ConceptDraw PRO v10 software with the ability to easily draw the Fishbone Diagrams (Ishikawa Diagrams) to clearly see the cause and effect analysis and also problem solving. The vector graphic diagrams produced using this solution can be used in whitepapers, presentations, datasheets, posters, and published technical material.
 Presentation Exchange
This solution extends ConceptDraw MINDMAP software with the ability to import presentations from Microsoft PowerPoint, as well as enhancing its existing presentation capabilities.
- Physics Practical Charts Diagrams
- Physical LAN and WAN diagram - Template
- Logical network topology diagram | Network diagrams with ...
- Physical Security Plan | CCTV Surveillance System Diagram . CCTV ...
- Physical Security Plan | CCTV Surveillance System Diagram . CCTV ...
- Security system floor plan | Physical Security Plan | Security and ...
- How To Create CCTV Network Diagram | Physical Security Plan ...
- Physical Security Plan | Security and Access Plans | CCTV ...
- Wide area network (WAN) topology. Computer and Network ...
- Free-body diagram | Physics | Physics Diagrams | Examples With ...
- Practical Chart Physics
- Physical Security Plan | Security and Access Plans | Security Plans ...
- Drawing Of An Internet Map Including Wans And Cloud Computing
- Line Chart Template for Word | Physics Symbols | Physics Diagrams ...
- Physical Security Plan | How To use House Electrical Plan Software ...
- Draw A Sketch Map Of The Local Area
- Security and Access Plans | Gantt chart examples | Network Security ...
- Computer Prktical Easy Charts
- Design elements - Physical training | Fitness Plans | Gym and Spa ...
- Physics Symbols | Education | Physics | Mind Map On Optics

