HelpDesk
How to Draw Physics Diagrams
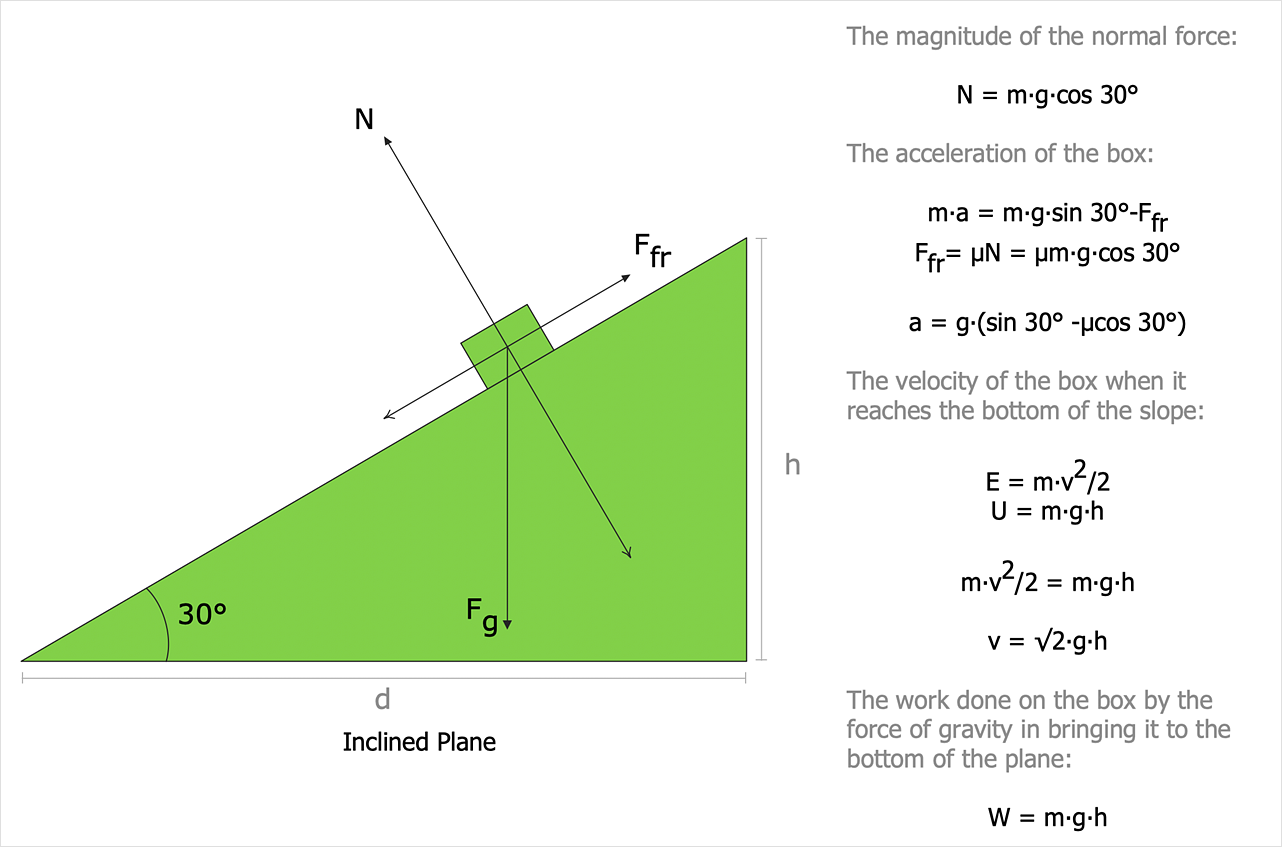
Nothing is more helpful in the study of physics as a visual representation of the physical processes: physics schemes, diagrams, and illustrations. Physics charts can be helpful when you learn Physics, perform experiments, or solve any other tasks regarding Physics. ConceptDraw DIAGRAM allows you to draw physical diagrams of mechanical, nuclear, optical and electrical processes using the set of vector physics symbols and physics diagram templates.Software development with ConceptDraw DIAGRAM
Modern software development requires creation of large amount of graphic documentation, these are the diagrams describing the work of applications in various notations and cuts, also GUI design and documentation on project management. ConceptDraw DIAGRAM technical and business graphics application possesses powerful tools for software development and designing technical documentation for object-oriented projects. Solutions included to the Software Development area of ConceptDraw Solution Park provide the specialists with possibility easily and quickly create graphic documentation. They deliver effective help in drawing thanks to the included package of templates, samples, examples, and libraries with numerous ready-to-use vector objects that allow easily design class hierarchies, object hierarchies, visual object-oriented designs, flowcharts, GUI designs, database designs, visualize the data with use of the most popular notations, including the UML and Booch notations, easy manage the development projects, automate projection and development.
 Venn Diagrams
Venn Diagrams are actively used to illustrate simple set relationships in set theory and probability theory, logic and statistics, mathematics and computer science, linguistics, sociology, and marketing. Venn Diagrams are also often used to visually summarize the status and future viability of a project.
 Telecommunication Network Diagrams
Telecommunication Network Diagrams solution extends ConceptDraw DIAGRAM software with samples, templates, and great collection of vector stencils to help the specialists in a field of networks and telecommunications, as well as other users to create Computer systems networking and Telecommunication network diagrams for various fields, to organize the work of call centers, to design the GPRS networks and GPS navigational systems, mobile, satellite and hybrid communication networks, to construct the mobile TV networks and wireless broadband networks.
 Enterprise Architecture Diagrams
Enterprise Architecture Diagrams solution extends ConceptDraw DIAGRAM software with templates, samples and library of vector stencils for drawing the diagrams of enterprise architecture models.
 Event-driven Process Chain Diagrams
Event-Driven Process Chain Diagrams solution extends ConceptDraw DIAGRAM functionality with event driven process chain templates, samples of EPC engineering and modeling the business processes, and a vector shape library for drawing the EPC diagrams and EPC flowcharts of any complexity. It is one of EPC IT solutions that assist the marketing experts, business specialists, engineers, educators and researchers in resources planning and improving the business processes using the EPC flowchart or EPC diagram. Use the EPC solutions tools to construct the chain of events and functions, to illustrate the structure of a business process control flow, to describe people and tasks for execution the business processes, to identify the inefficient businesses processes and measures required to make them efficient.
 Fault Tree Analysis Diagrams
This solution extends ConceptDraw DIAGRAM.5 or later with templates, fault tree analysis example, samples and a library of vector design elements for drawing FTA diagrams (or negative analytical trees), cause and effect diagrams and fault tree diagrams.
 Windows 10 User Interface
Windows 10 User Interface solution extends significantly ConceptDraw DIAGRAM functionality with look-and-feel functions of GUI software and makes it a great assistant for Win10 designers, developers, and software engineers. This solution provides a wide s
- Bio Flowchart Lite | ConceptDraw Solution Park | Physics Diagrams ...
- Pyramid Chart Maker | Physics Diagrams | Flowchart Software ...
- Physics Diagram Maker
- Physics Diagrams | Physics Symbols | Astronomy Symbols | Drawing ...
- Top 5 Android Flow Chart Apps | Flow Chart Online | Online ...
- Mathematics Symbols | Mathematical Diagrams | Basic Flowchart ...
- Process Flowchart | Flow Map | Physics Symbols | Draw Five Types ...
- Biology Diagram Maker Software Download For Pc
- Physics Diagrams | Venn Diagram Examples for Problem Solving ...
- Best Free Software For Drawing Biology Diagram
- Process Flowchart | Types of Flowchart - Overview | Physics ...
- How to Draw Physics Diagrams in ConceptDraw PRO | Physics ...
- Top 5 Android Flow Chart Apps | Process Flowchart | Entity ...
- Process Flowchart | Bio Flowchart Lite | Business Diagram Software ...
- Biology Drawing Software | How to Draw Biology Diagram in ...
- Download Making Blueprints For Physics Experinment App For Pc
- Top 5 Android Flow Chart Apps | Emergency Plan | CAD Drawing ...
- Mechanical Drawing Symbols | CAD Drawing Software for Making ...
- Offensive Play – Double Wing Wedge – Vector Graphic Diagram ...
- ERD Symbols and Meanings | Entity Relationship Diagram Symbols ...

