HelpDesk
How to Draw Physics Diagrams
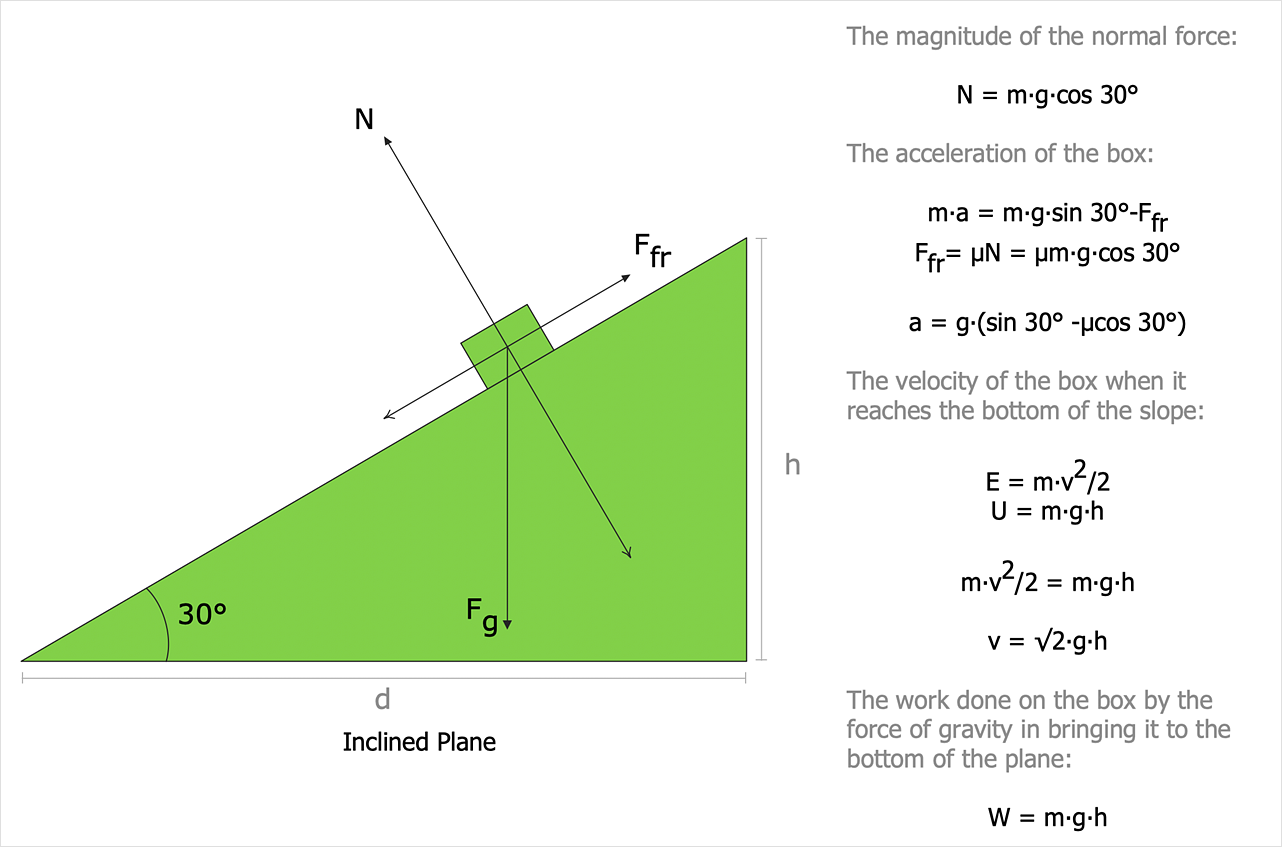
Nothing is more helpful in the study of physics as a visual representation of the physical processes: physics schemes, diagrams, and illustrations. Physics charts can be helpful when you learn Physics, perform experiments, or solve any other tasks regarding Physics. ConceptDraw DIAGRAM allows you to draw physical diagrams of mechanical, nuclear, optical and electrical processes using the set of vector physics symbols and physics diagram templates.
 Physics
Physics solution extends ConceptDraw DIAGRAM software with templates, samples and libraries of vector stencils for drawing the physical illustrations, diagrams and charts.
Software development with ConceptDraw DIAGRAM
Modern software development requires creation of large amount of graphic documentation, these are the diagrams describing the work of applications in various notations and cuts, also GUI design and documentation on project management. ConceptDraw DIAGRAM technical and business graphics application possesses powerful tools for software development and designing technical documentation for object-oriented projects. Solutions included to the Software Development area of ConceptDraw Solution Park provide the specialists with possibility easily and quickly create graphic documentation. They deliver effective help in drawing thanks to the included package of templates, samples, examples, and libraries with numerous ready-to-use vector objects that allow easily design class hierarchies, object hierarchies, visual object-oriented designs, flowcharts, GUI designs, database designs, visualize the data with use of the most popular notations, including the UML and Booch notations, easy manage the development projects, automate projection and development.HelpDesk
How to Draw a Circular Arrows Diagram
The cyclic recurrence is a fundamental property of multiple systems. The cycle is a process which consists from elements (phases, stages, stages) following each other. Many processes in astronomy, biology, chemistry, physics, mathematics, etc. have a cycle properties. It is also widely used in information technologies and marketing analysis. Graphical representation of cyclic processes can have many forms. It can be a circle, parabola, hyperbola, ellipse and others. A Circular Arrows Diagram is used as one of the statistical charts in the business, mass media and marketing. ConceptDraw DIAGRAM provides its users tools for making easy drawing Circular Arrows Diagrams.
 ConceptDraw Solution Park
ConceptDraw Solution Park collects graphic extensions, examples and learning materials
Is ConceptDraw DIAGRAM an Alternative to Microsoft Visio?
Visio for Mac and Windows - ConceptDraw as an alternative to MS Visio. ConceptDraw DIAGRAM delivers full-functioned alternative to MS Visio. ConceptDraw DIAGRAM supports import of Visio files. ConceptDraw DIAGRAM supports flowcharting, swimlane, orgchart, project chart, mind map, decision tree, cause and effect, charts and graphs, and many other diagram types.- Project Of Physics Draw To Chart All
- Project Management Area | Fishbone Diagrams | Drawings On ...
- How to Draw Physics Diagrams in ConceptDraw PRO | Physics ...
- How to Draw Physics Diagrams in ConceptDraw PRO | Line Chart ...
- Basic Flowchart Symbols and Meaning | Sample Project Flowchart ...
- How to Draw Physics Diagrams in ConceptDraw PRO | Workflow ...
- Physics Diagrams | Bar Chart Software | Program Evaluation and ...
- How to Draw Physics Diagrams in ConceptDraw PRO | Physics ...
- Physics Diagrams | Physics Symbols | How to Draw Physics ...
- Physics Diagrams | How to Draw Physics Diagrams in ConceptDraw ...
- Entity-Relationship Diagram (ERD) | Physics Symbols | Data Flow ...
- How to Draw Physics Diagrams in ConceptDraw PRO | Physics ...
- Physics Diagrams | How to Draw Physics Diagrams in ConceptDraw ...
- Physics | Optics - Vector stencils library | Physics Diagrams ...
- Physics Diagrams | How to Draw Physics Diagrams in ConceptDraw ...
- Biology | Process Flowchart | How to Draw Biology Diagram in ...
- MS Visio Look a Like Diagrams | Physics Diagrams | Powerful ...
- Concept Drawing In Mechanical
- How to Draw Physics Diagrams in ConceptDraw PRO | Physics ...
- Physics Diagrams | How to Draw Physics Diagrams in ConceptDraw ...


