Mathematics Symbols
ConceptDraw PRO extended with Mathematics solution from the Science and Education area is a powerful diagramming and vector drawing software that offers all needed tools for mathematical diagrams designing. Mathematics solution provides 3 libraries with predesigned vector mathematics symbols and figures: Solid Geometry Library, Plane Geometry Library and Trigonometric Functions Library.Electrical Symbols, Electrical Diagram Symbols
When drawing Electrical Schematics, Electrical Circuit Diagrams, Power Systems Diagrams, Circuit and Wiring Diagrams, Digital and Analog Logic Schemes, you will obligatory need the electrical symbols and pictograms to represent various electrical and electronic devices, such as resistors, wires, transistors, inductors, batteries, switches, lamps, readouts, amplifiers, repeaters, relays, transmission paths, semiconductors, generators, and many more. Today these symbols are internationally standardized, so the diagrams designed using them are recognizable and comprehensible by specialists from different countries. Electrical Engineering Solution included to ConceptDraw Solution Park provides 26 libraries with 926 commonly used electrical schematic and electrical engineering symbols making the reality the easy drawing of Electrical diagrams, schematics and blueprints. Now you need only a few minutes to create great-looking Electrical diagram, simply choose required electrical design elements from the libraries, drag them on the needed places at the document and connect in a suitable way.Physics Diagrams
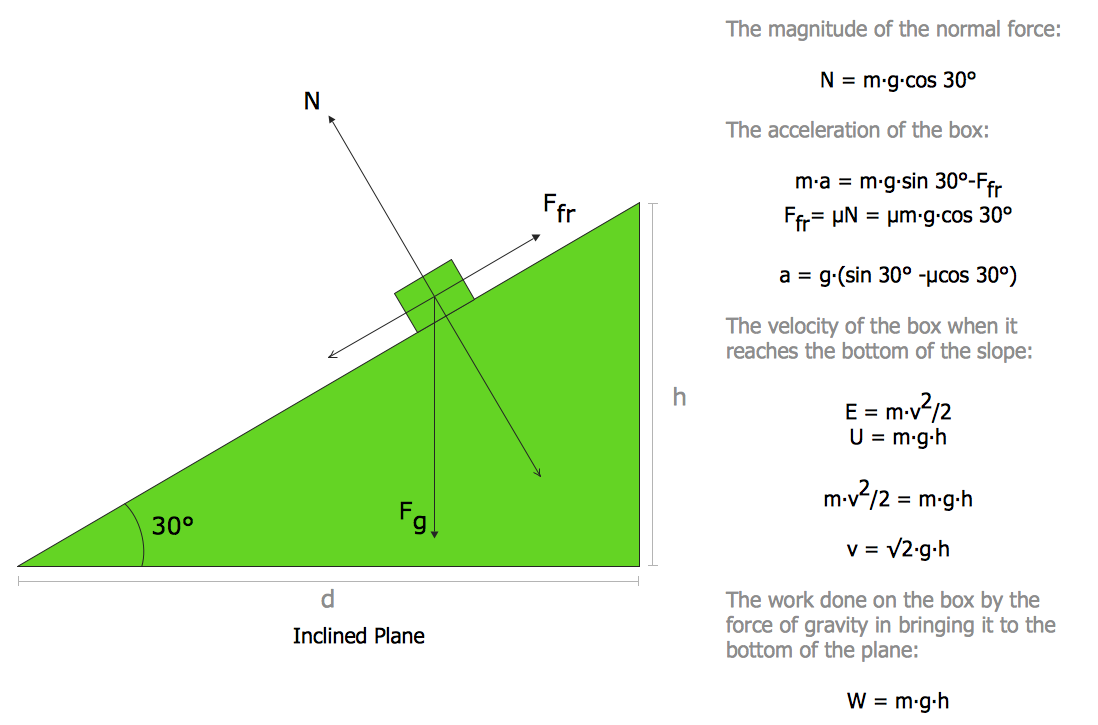
ConceptDraw PRO diagramming and vector drawing software extended with Physics solution from the Science and Education area is the best for creating: physics diagrams, pictures which describe various physical facts and experiments, illustrations of various electrical, mechanical and optic processes, of any complexity quick and easy.Basic Diagramming
Mathematics is an exact science, which studies the values, spatial forms and quantitative relations. It is a science, in which is built large number of various diagrams, charts and graphs that present the material in a clear, visual and colorful form, help to analyze the information and to make certain conclusions. A diagram is a graphical representation of data using the linear segments or geometric shapes, which allows to evaluate the ratio of several values. Depending on the types of solved tasks are used the diagrams of different kinds. A graph is a diagram that shows quantitative dependencies of various processes using the curves. ConceptDraw PRO is a powerful intelligent and multifunctional vector engine for drawing different Mathematical diagrams and graphs, Mathematical illustrations, complex and simple Diagram mathematics, Flowcharts of equation solving process, Line graphs, Scatter plots, Histograms, Block diagrams, Bar charts, Divided bar diagrams, Pie charts, Area charts, Circular arrows diagrams, Venn diagrams, Bubble diagrams, Concept maps, and many others.
Chemistry Equation Symbols
If you are related with chemistry in you work or education activity, you need often draw various illustrations with chemistry equations. ConceptDraw PRO diagramming and vector drawing software offers you the Chemistry solution from the Science and Education area. Chemistry solution provides the Chemical Drawings Library with large quantity of vector chemistry equation symbols to help you create professional looking chemistry diagrams quick and easy.Sales Process
ConceptDraw PRO is effective software for a variety of activity fields. Now, extended with Sales Flowcharts solution from the Marketing area of ConceptDraw Solution Park it become also useful in the field of sales. It helps to design professional looking Sales Flowcharts, Sales Process Flowcharts, Sales Process Maps, Plans and Diagrams to effectively realize the process of selling a product or service, and to display the sales results.
 Object-Role Modeling (ORM) Diagrams
Object-role Modeling (ORM) Diagram solution with powerful vector diagramming and data modeling tools, large quantity of specially developed samples and examples, and rich variety of vector objects corresponding to common ORM notation, ideally suits for developing the comprehensive, clear and visual Object-role Modeling (ORM) diagrams and schematics, understandable for all interested people from the different fields and business directions, for designing the ORM models, and demonstrating advantages from the use of ORM and its notation. It is intended for software developers and computer engineers, specialists in a field of Object-oriented programming (OOP), database architects, web-application constructors and developers, etc.
 Fishbone Diagrams
The Fishbone Diagrams solution extends ConceptDraw PRO v10 software with the ability to easily draw the Fishbone Diagrams (Ishikawa Diagrams) to clearly see the cause and effect analysis and also problem solving. The vector graphic diagrams produced using this solution can be used in whitepapers, presentations, datasheets, posters, and published technical material.
 macOS User Interface
macOS User Interface solution extends the ConceptDraw PRO functionality with powerful GUI software graphic design features and tools. It provides an extensive range of multifarious macOS Sierra user interface design examples, samples and templates, and wide variety of libraries, containing a lot of pre-designed vector objects of Mac Apps icons, buttons, dialogs, menu bars, indicators, pointers, controls, toolbars, menus, and other elements for fast and simple designing high standard user interfaces of any complexity for new macOS Sierra.
 GHS Hazard Pictograms
GHS Hazard Pictograms solution contains the set of predesigned standard GHS pictograms, Hazardous symbols, and Hazard communication pictograms, approved and agreed by UN in Globally Harmonized System of Classification and Labelling of Chemicals (GHS). They can be used for quick and simple designing accurate and professional-looking infographics, diagrams, warning announcements, signboards, posters, precautionary declarations, regulatory documents, and for representing the main items of OSHA HAZCOM Standard.
- Math And Physics Symbol Name
- Mathematics Object In Names Symbols
- List Of Physics Symbols And Their Names
- Physics And Mathematics Symbols And Names
- Physics Symbols And Their Names
- Physics All Symbol Name Pdf
- Chemistry Symbols and Meanings | Solar System Symbols | Physics ...
- Physics All Symbols Name For Pdf
- Pic Of Symbols Use In Physics With There Name


