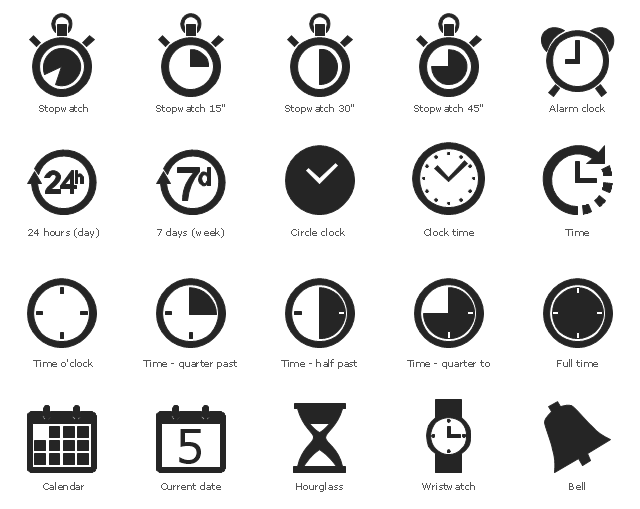
The vector stencils library "Time and clock pictograms" contains 20 time pictograms: clocks, calendars, day, week, bell, alarm clock, hourglass, wristwatch, and time intervals symbols.
Use it to create temporal infographic, illustrations and diagrams.
The example "Time and clock pictograms - Vector stencils library" was created using the ConceptDraw PRO diagramming and vector drawing software extended with the Pictorial infographics solution from the area "What is infographics" in ConceptDraw Solution Park.
Time

Stopwatch

Stopwatch 15"
Stopwatch 30"
Stopwatch 45"
24 h
7 d
Circle clock

Clock time

Time o'clock
Time - quarter past

Time - half past

Time - quarter to

Full time

Calendar

Current date

Hourglass

Wristwatch

Alarm clock

Bell

The vector stencils library "Time and clock pictograms" contains 20 time pictograms: clocks, calendars, day, week, bell, alarm clock, hourglass, wristwatch, and time intervals symbols.
Use it to create temporal infographic, illustrations and diagrams.
The pictograms example "Design elements - Time and clock pictograms" was created using the ConceptDraw PRO diagramming and vector drawing software extended with the Pictorial Infographic solution from the area "What is infographics" in ConceptDraw Solution Park.
Temporal pictograms
OSHA HAZCOM pictograms

 GHS Hazard Pictograms
GHS Hazard Pictograms solution contains the set of predesigned standard GHS pictograms, Hazardous symbols, and Hazard communication pictograms, approved and agreed by UN in Globally Harmonized System of Classification and Labelling of Chemicals (GHS). They can be used for quick and simple designing accurate and professional-looking infographics, diagrams, warning announcements, signboards, posters, precautionary declarations, regulatory documents, and for representing the main items of OSHA HAZCOM Standard.
Design Pictorial Infographics. Design Infographics

Infographic Maker

Winter Sports Vector Clipart. Medal Map. Spatial Infographics

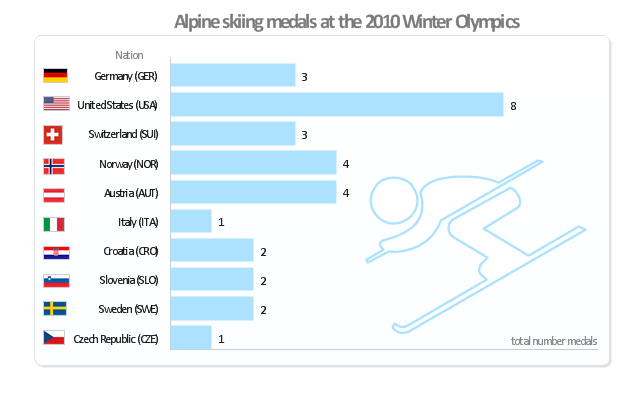
"Alpine skiing at the 2010 Winter Olympics was held at Whistler Creekside in Whistler, British Columbia, Canada. The ten events were scheduled for 13–27 February, 2010; weather delayed the first event, the men's downhill, two days until Monday, 15 February. ... Notably absent from the medals in these Olympics were the Austrian men, who had won 8 medals in 2006 and 7 in 2002. France and host Canada were shut out from the podium, as were the German men and the Swiss and Italian women. The U.S. had its best Olympics ever with eight alpine medals, only the fourth nation to achieve that total in a single Olympics (Austria, France, Switzerland). Individually, three men and five women won multiple medals; triple medalists were Bode Miller of the U.S. and Aksel Lund Svindal of Norway, who both won a medal of each color. The sole double gold medalist was Maria Riesch of Germany." [Alpine skiing at the 2010 Winter Olympics. wikipedia]
This medal bar chart example "Alpine skiing at the 2010 Winter Olympics" was created using the ConceptDraw PRO diagramming and vector drawing software extended with the Winter Sports solution.
The Winter Sports solution from the Sport area of ConceptDraw Solution Park contains the vector stencils library "Winter sports pictograms" and examples of diagrams and infographics.
Medal bar chart
Content Marketing Infographics

 Winter Sports
The Winter Sports solution from Sport area of ConceptDraw Solution Park contains winter sports illustration examples, templates and vector clipart libraries.
- Working Day Pictogram
- Marketing Plan Infographic | Market Day Pictogram
- Time and clock pictograms - Vector stencils library | Time and clock ...
- Time and clock pictograms - Vector stencils library | Design ...
- Time and clock pictograms - Vector stencils library | Calendars ...
- Design elements - Time and clock pictograms | Time and clock ...
- Time and clock pictograms - Vector stencils library | Piktogram Home
- Calendars - Vector stencils library | Education pictograms - Vector ...
- Proposed Patient Appointment Procedure | Time and clock ...
- Time and clock pictograms - Vector stencils library | Funny aquatic ...
- Time and clock pictograms - Vector stencils library | How to ...
- Basketball Court Dimensions | Graphic User Interface | Time and ...
- How to Customize a Task's Duration | Time and clock pictograms ...
- Time - Design Elements | Time and clock pictograms - Vector ...
- Half Day Icon
- Sport pictograms . Olympic Games | GHS Hazard Pictograms ...
- Time - Vector stencils library | Time and clock pictograms - Vector ...
- How To use House Electrical Plan Software | Time and clock ...
- Time - Design Elements | Basketball Court Dimensions | Time and ...
- Time and clock pictograms - Vector stencils library | Time - Vector ...