 Divided Bar Diagrams
The Divided Bar Diagrams Solution extends the capabilities of ConceptDraw DIAGRAM with templates, samples, and a library of vector stencils for drawing high impact and professional Divided Bar Diagrams and Graphs, Bar Diagram Math, and Stacked Graph.
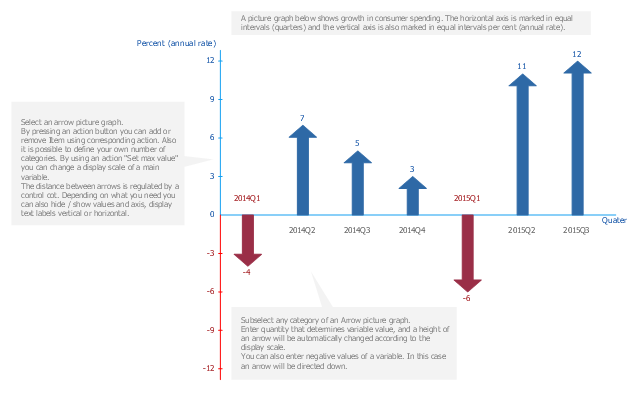
A picture chart (image chart, pictorial graph) is the type of a bar graph visualizing numarical data using symbols and pictograms.
In the field of economics and finance use a picture graph with columns in the form of coins. For population comparison statistics use a chart with columns in the form of manikins. To show data increase or decrease use arrows bar charts.
The arrow chart template "Picture graph" for the ConceptDraw PRO diagramming and vector drawing software is included in the Basic Picture Graphs solution from the Graphs and Charts area of ConceptDraw Solution Park.
Arrows bar graph template
 ConceptDraw Solution Park
ConceptDraw Solution Park collects graphic extensions, examples and learning materials
 Fishbone Diagrams
The Fishbone Diagrams solution extends ConceptDraw DIAGRAM software with the ability to easily draw the Fishbone Diagrams (Ishikawa Diagrams) to clearly see the cause and effect analysis and also problem solving. The vector graphic diagrams produced using this solution can be used in whitepapers, presentations, datasheets, posters, and published technical material.
 Rack Diagrams
The Rack Diagrams solution, including a vector stencil library, a collection of samples and a quick-start template, can be useful for all who deal with computer networks. Choosing any of the 54 library's vector shapes, you can design various types of Rack diagrams or Server rack diagrams visualizing 19" rack mounted computers and servers.
 ATM UML Diagrams
The ATM UML Diagrams solution lets you create ATM solutions and UML examples. Use ConceptDraw DIAGRAM as a UML diagram creator to visualize a banking system.
 SYSML
SYSML
The SysML solution helps to present diagrams using Systems Modeling Language; a perfect tool for system engineering.
 Business Process Mapping
The Business Process Mapping solution for ConceptDraw DIAGRAM is for users involved in process mapping and creating SIPOC diagrams.
 Circle-Spoke Diagrams
Examples of subject areas that are well suited to this approach are marketing, business, products promotion, process modeling, market, resource, time, and cost analysis. Circle-Spoke Diagrams are successfully used in presentations, conferences, management documents, magazines, reportages, reviews, reports, TV, and social media.
 Block Diagrams
Block diagrams solution extends ConceptDraw DIAGRAM software with templates, samples and libraries of vector stencils for drawing the block diagrams.
ERD Symbols and Meanings


- Sample Pictorial Chart . Sample Infographics | Design elements ...
- Picture graphs - Vector stencils library | Management indicators ...
- Graphics Pictogram Charts Interesting
- Bar Chart Template for Word | Double bar graph - Template | Bar ...
- Picture graph - Template
- Barchart Histogram Pictogram
- Picture Chart Templates
- Picture Graphs | Picture Graph | How to Create a Picture Graph in ...
- Bar Chart Infographic Design
- Picture graph - Template
- Pictograph
- Feature Comparison Chart Software | Bar Chart Template for Word ...
- Arrows Bar Chart
- Education Bar Chart
- Circular Flow Diagram Template | Triangle scheme with arrows ...
- Bar Graphs | Basic Bar Graphs | Marketing infogram 3 - Template ...
- Basic Flowchart Images. Flowchart Examples | Image chart - The ...
- Types of Flowcharts | Ecology pictograms - Vector stencils library ...
- Bar Graph Template Population Increase
- Design elements - Marketing pictograms | Management pictograms ...