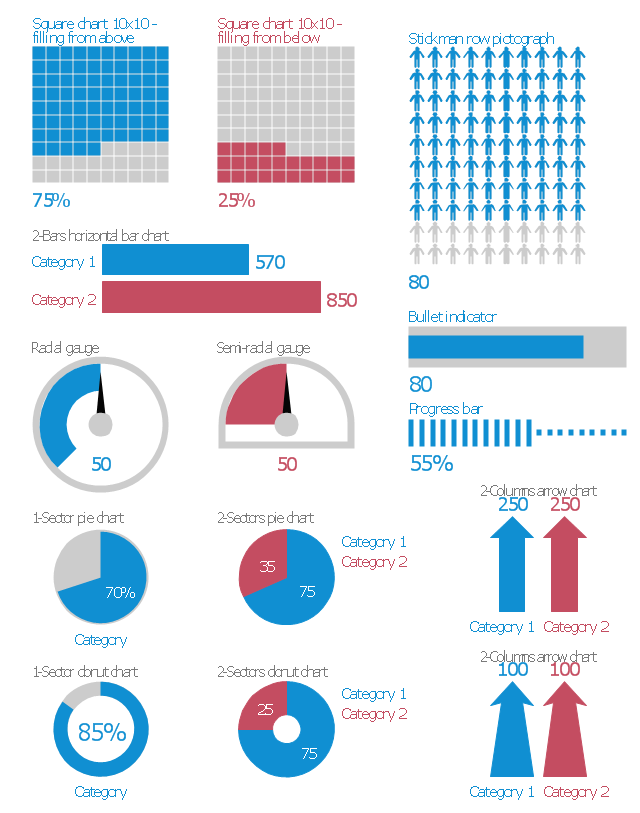
The vector stencils library "Marketing indicators" contains 12 graphic indicators: horizontal bar chart, pie chart, arrow chart, donut chart, square chart, stickman row pictograph, progress bar, bullet indicator, radial gauge, semi-radial gauge.
Use these visual indicators to design your marketing infograms.
The shapes example "Design elements - Marketing indicators" was created using the ConceptDraw PRO diagramming and vector drawing software extended with the Marketing Infographics solition from the area "Business Infographics" in ConceptDraw Solution Park.
Graphic indicators

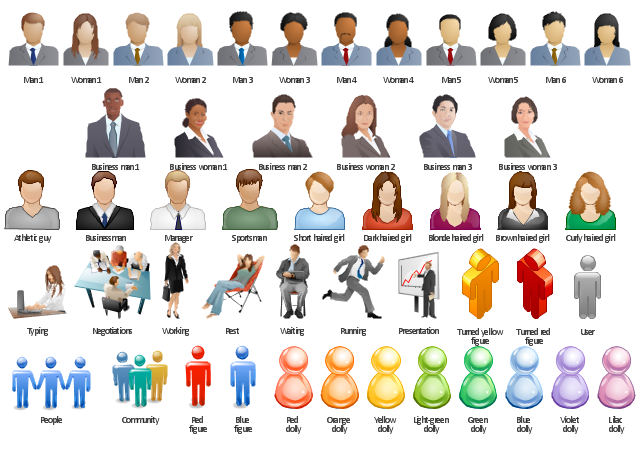
The vector stencils library "Marketing pictograms" contains pictogram set of 34 flaticons.
Use these flat icons to design your marketing infograms.
"A pictogram, also called a pictogramme, pictograph, or simply picto, and also an 'icon', is an ideogram that conveys its meaning through its pictorial resemblance to a physical object. Pictographs are often used in writing and graphic systems in which the characters are to a considerable extent pictorial in appearance." [Pictogram. Wikipedia]
The shapes example "Design elements - Marketing pictograms" was created using the ConceptDraw PRO diagramming and vector drawing software extended with the Marketing Infographics solition from the area "Business Infographics" in ConceptDraw Solution Park.
Flat icons
Design Pictorial Infographics. Design Infographics

The vector clip art library People contains 49 images and pictograms of men and women you can use to draw your illustrations using the ConceptDraw PRO diagramming and vector drawing software.
"Clip art, in the graphic arts, refers to pre-made images used to illustrate any medium. Today, clip art is used extensively in both personal and commercial projects, ranging from home-printed greeting cards to commercial candles. Clip art comes in many forms, both electronic and printed. However, most clip art today is created, distributed, and used in an electronic form." [Clip art. Wikipedia]
"A pictogram, also called a pictogramme, pictograph, or simply picto, and also an 'icon', is an ideogram that conveys its meaning through its pictorial resemblance to a physical object. Pictographs are often used in writing and graphic systems in which the characters are to a considerable extent pictorial in appearance.
Pictography is a form of writing which uses representational, pictorial drawings, similarly to cuneiform and, to some extent, hieroglyphic writing, which also uses drawings as phonetic letters or determinative rhymes. In certain modern use, pictograms participate to a formal language..." [Pictogram. Wikipedia]
The vector stencils library People is included in the People solution from the Illustration area of ConceptDraw Solution Park.
Vector clip art
Electrical Symbols, Electrical Diagram Symbols

The vector stencils library "Picture bar graphs" contains 35 templates of pictorial charts. Use it for visualization of data comparison and time series with ConceptDraw PRO diagramming and vector drawing software.
"Pictorial bar graph.
Sometimes reffered to as a pictographs. A pictorial bar graph is a graph in which the rectangular bars have been filled with pictures, sketches, icons, etc. or where pictures, sketches, icons, etc. have been substituted for the rectangular bars. In both variations, one or more symbols might be used in each bar. The two major reasons for using pictorial graphs are to make the graph more appealing visually and to facilitate better communications." [Information Graphics: A Comprehensive Illustrated Reference. R. L. Harris. 1999. p.41]
The pictorial charts example "Design elements - Picture bar graphs" is included in the Picture Graphs solution from the Graphs and Charts area of ConceptDraw Solution Park.
Templates

The vector stencils library "Picture Graphs" contains 4 image chart templates. Use it to design your pictorial bar charts in ConceptDraw PRO diagramming and vector drawing software.
"Pictorial bar graph.
Sometimes reffered to as a pictographs. A pictorial bar graph is a graph in which the rectangular bars have been filled with pictures, sketches, icons, etc. or where pictures, sketches, icons, etc. have been substituted for the rectangular bars. In both variations, one or more symbols might be used in each bar. The two major reasons for using pictorial graphs are to make the graph more appealing visually and to facilitate better communications." [Information Graphics: A Comprehensive Illustrated Reference. R. L. Harris. 1999. p.41]
The chart templates example "Design elements - Picture graphs" is included in the Basic Picture Graphs solution from the Graphs and Charts area of ConceptDraw Solution Park.
Pictorial chart templates

The vector stencils library "Management indicators" contains 14 graphic indicators: horizontal bar chart, pie chart, arrow chart, donut chart, square chart, stickman row pictograph, progress bar, bullet indicator, radial gauge, semi-radial gauge.
Use these visual indicators to design your management infograms.
The shapes example "Design elements - Management indicators" was created using the ConceptDraw PRO diagramming and vector drawing software extended with the Management Infographics solition from the area "Business Infographics" in ConceptDraw Solution Park.
Graphic indicators
- Design elements - Marketing pictograms | Management indicators ...
- Picture Graph Or Pictograph
- Design Pictorial Infographics. Design Infographics | Examples Of ...
- Design elements - IVR Internet | Design Pictorial Infographics ...
- How To Design Regulatory Documents with use of Standard GHS ...
- Design elements - Marketing pictograms | Management pictograms ...
- Design elements - Marketing pictograms | Design elements - People ...
- Management indicators - Vector stencils library | Design elements ...
- Trolley Pictograph