The vector stencils library "Picture Graphs" contains 35 templates of picture bar graphs for visual data comparison and time series.
Drag a template from the library to your document, set bars number, type category labels, select bars and enter your data.
Use these shapes to draw your pictorial bar charts in the ConceptDraw PRO diagramming and vector drawing software.
The vector stencils library "Picture Graphs" is included in the Picture Graphs solution from the Graphs and Charts area of ConceptDraw Solution Park.
Arrow
Water drop

Food

Grain

Agriculture

Medicines

Houses

Buildings

Money bags

Oil barrels

Natural gas

Electrical power

Nuclear power

Mechanical engineering

Chemical industry

Mining

Gold bars

Coins

Person

Men, women and children

Man

Woman

Child

Milk

Meat

Fruits

Vegetables

Computer

Mobile phone

Airliner

Car

Bus

Truck

Train

Cargo ship

Flow chart Example. Warehouse Flowchart


Process Flowchart


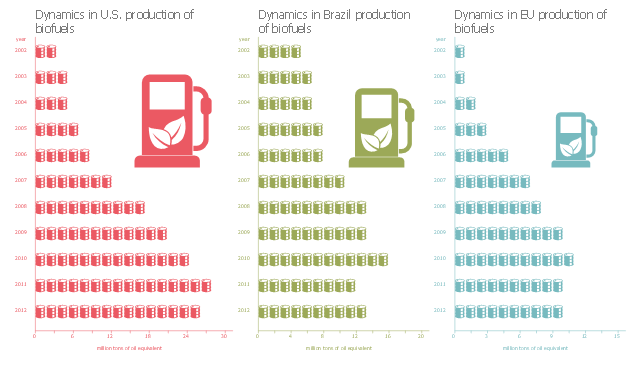
This picture bar graph sample shows biofuels production dynamics in U.S., Brazil and EU from 2002 to 2012. It was designed on the base of the Wikimedia Commons file: Production of biofuels.jpg.
[commons.wikimedia.org/ wiki/ File:Production_ of_ biofuels.jpg]
This file is made available under the Creative Commons CC0 1.0 Universal Public Domain Dedication. [creativecommons.org/ publicdomain/ zero/ 1.0/ deed.en]
"A biofuel is a fuel that is produced through contemporary biological processes, such as agriculture and anaerobic digestion, rather than a fuel produced by geological processes such as those involved in the formation of fossil fuels, such as coal and petroleum, from prehistoric biological matter. Biofuels can be derived directly from plants, or indirectly from agricultural, commercial, domestic, and/ or industrial wastes. Renewable biofuels generally involve contemporary carbon fixation, such as those that occur in plants or microalgae through the process of photosynthesis. Other renewable biofuels are made through the use or conversion of biomass (referring to recently living organisms, most often referring to plants or plant-derived materials). This biomass can be converted to convenient energy-containing substances in three different ways: thermal conversion, chemical conversion, and biochemical conversion. This biomass conversion can result in fuel in solid, liquid, or gas form. This new biomass can also be used directly for biofuels." [Biofuel. Wikipedia]
The pictorial chart example "Production of biofuels" was created using the ConceptDraw PRO diagramming and vector drawing software extended with the Picture Graphs solution from the Graphs and Charts area of ConceptDraw Solution Park.
Image chart
 Area Charts
Area Charts are used to display the cumulative totals over time using numbers or percentages; or to show trends over time among related attributes. The Area Chart is effective when comparing two or more quantities. Each series of data is typically represented with a different color, the use of color transparency in an object’s transparency shows overlapped areas and smaller areas hidden behind larger areas.
The vector stencils library "Picture Graphs" contains 35 templates of picture bar graphs for visual data comparison and time series.
Drag a template from the library to your document, set bars number, type category labels, select bars and enter your data.
Use these shapes to draw your pictorial bar charts in the ConceptDraw PRO diagramming and vector drawing software.
The vector stencils library "Picture Graphs" is included in the Picture Graphs solution from the Graphs and Charts area of ConceptDraw Solution Park.
Drag a template from the library to your document, set bars number, type category labels, select bars and enter your data.
Use these shapes to draw your pictorial bar charts in the ConceptDraw PRO diagramming and vector drawing software.
The vector stencils library "Picture Graphs" is included in the Picture Graphs solution from the Graphs and Charts area of ConceptDraw Solution Park.
Arrow
Water drop
Food
Grain
Agriculture
Medicines
Houses
Buildings
Money bags
Oil barrels
Natural gas
Electrical power
Nuclear power
Mechanical engineering
Chemical industry
Mining
Gold bars
Coins
Person
Men, women and children
Man
Woman
Child
Milk
Meat
Fruits
Vegetables
Computer
Mobile phone
Airliner
Car
Bus
Truck
Train
Cargo ship
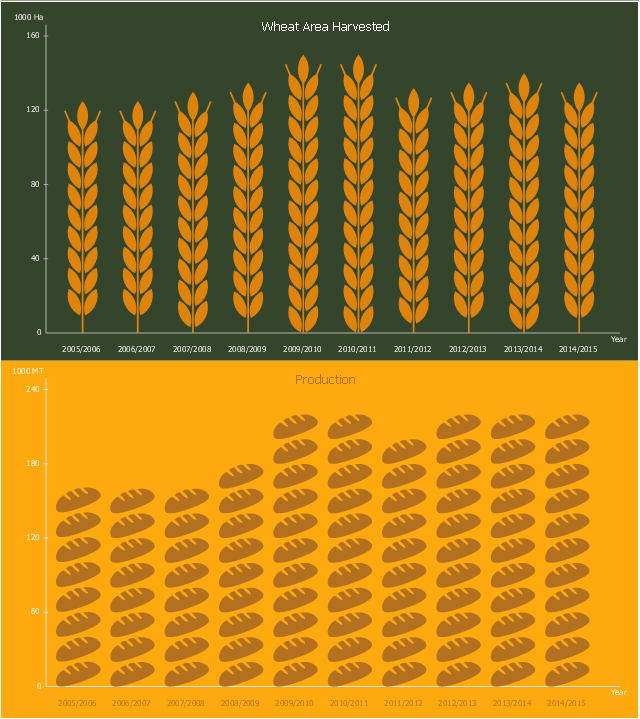
This picture bar graph sample shows wheat area harvested and production in Peru from 2006 to 2015. It was designed using data from website of the Foreign Agriculfural Service, the U.S. Department of Agriculture (USDA).
"Wheat remains a minor crop in Peru with most of the production concentrated in the temperate, southern highlands. Grown at 2,800 to 3,500 meters above sea level, production remains limited by geography as well as current economics. The Peruvian farmer cultivates only about two hectares of wheat, on average. While wheat production has increased slightly since 1994, it has remained relatively stable for the last six years at around 225,000 MT."
[fas.usda.gov/ data/ peru-wheat-production-limited-competition-corn-and-quinoa]
The pictorial chart example "Peru wheat area and production" was created using the ConceptDraw PRO diagramming and vector drawing software extended with the Picture Graphs solution from the Graphs and Charts area of ConceptDraw Solution Park.
Image chart
Electrical Symbols, Electrical Diagram Symbols

Fully Connected Network Topology Diagram

 Marketing Diagrams
Marketing Diagrams solution extends ConceptDraw PRO diagramming software with abundance of samples, templates and vector design elements intended for easy graphical visualization and drawing different types of Marketing diagrams and graphs, including Branding Strategies Diagram, Five Forces Model Diagram, Decision Tree Diagram, Puzzle Diagram, Step Diagram, Process Chart, Strategy Map, Funnel Diagram, Value Chain Diagram, Ladder of Customer Loyalty Diagram, Leaky Bucket Diagram, Promotional Mix Diagram, Service-Goods Continuum Diagram, Six Markets Model Diagram, Sources of Customer Satisfaction Diagram, etc. Analyze effectively the marketing activity of your company and apply the optimal marketing methods with ConceptDraw PRO software.