Flowchart Maker
A flowchart maker is a software showing the interaction, sequence or organization. It also known as flowchart maker or ConceptDraw DIAGRAM standard supplied with different types of symbol collections: standard symbols, branded set and authored. It used strictly for enhancing scientific or business documents with abstract explanatory pictures. Business graphic applications show a special knowledge representations and include many features for creating schematic pictures. These graphic tools are known as flowchart maker or flowchart maker software.Basic Diagramming
Perfect charts and graphics diagramming software with rich examples and template. ConceptDraw is ideal to draw Charts and Graphics.
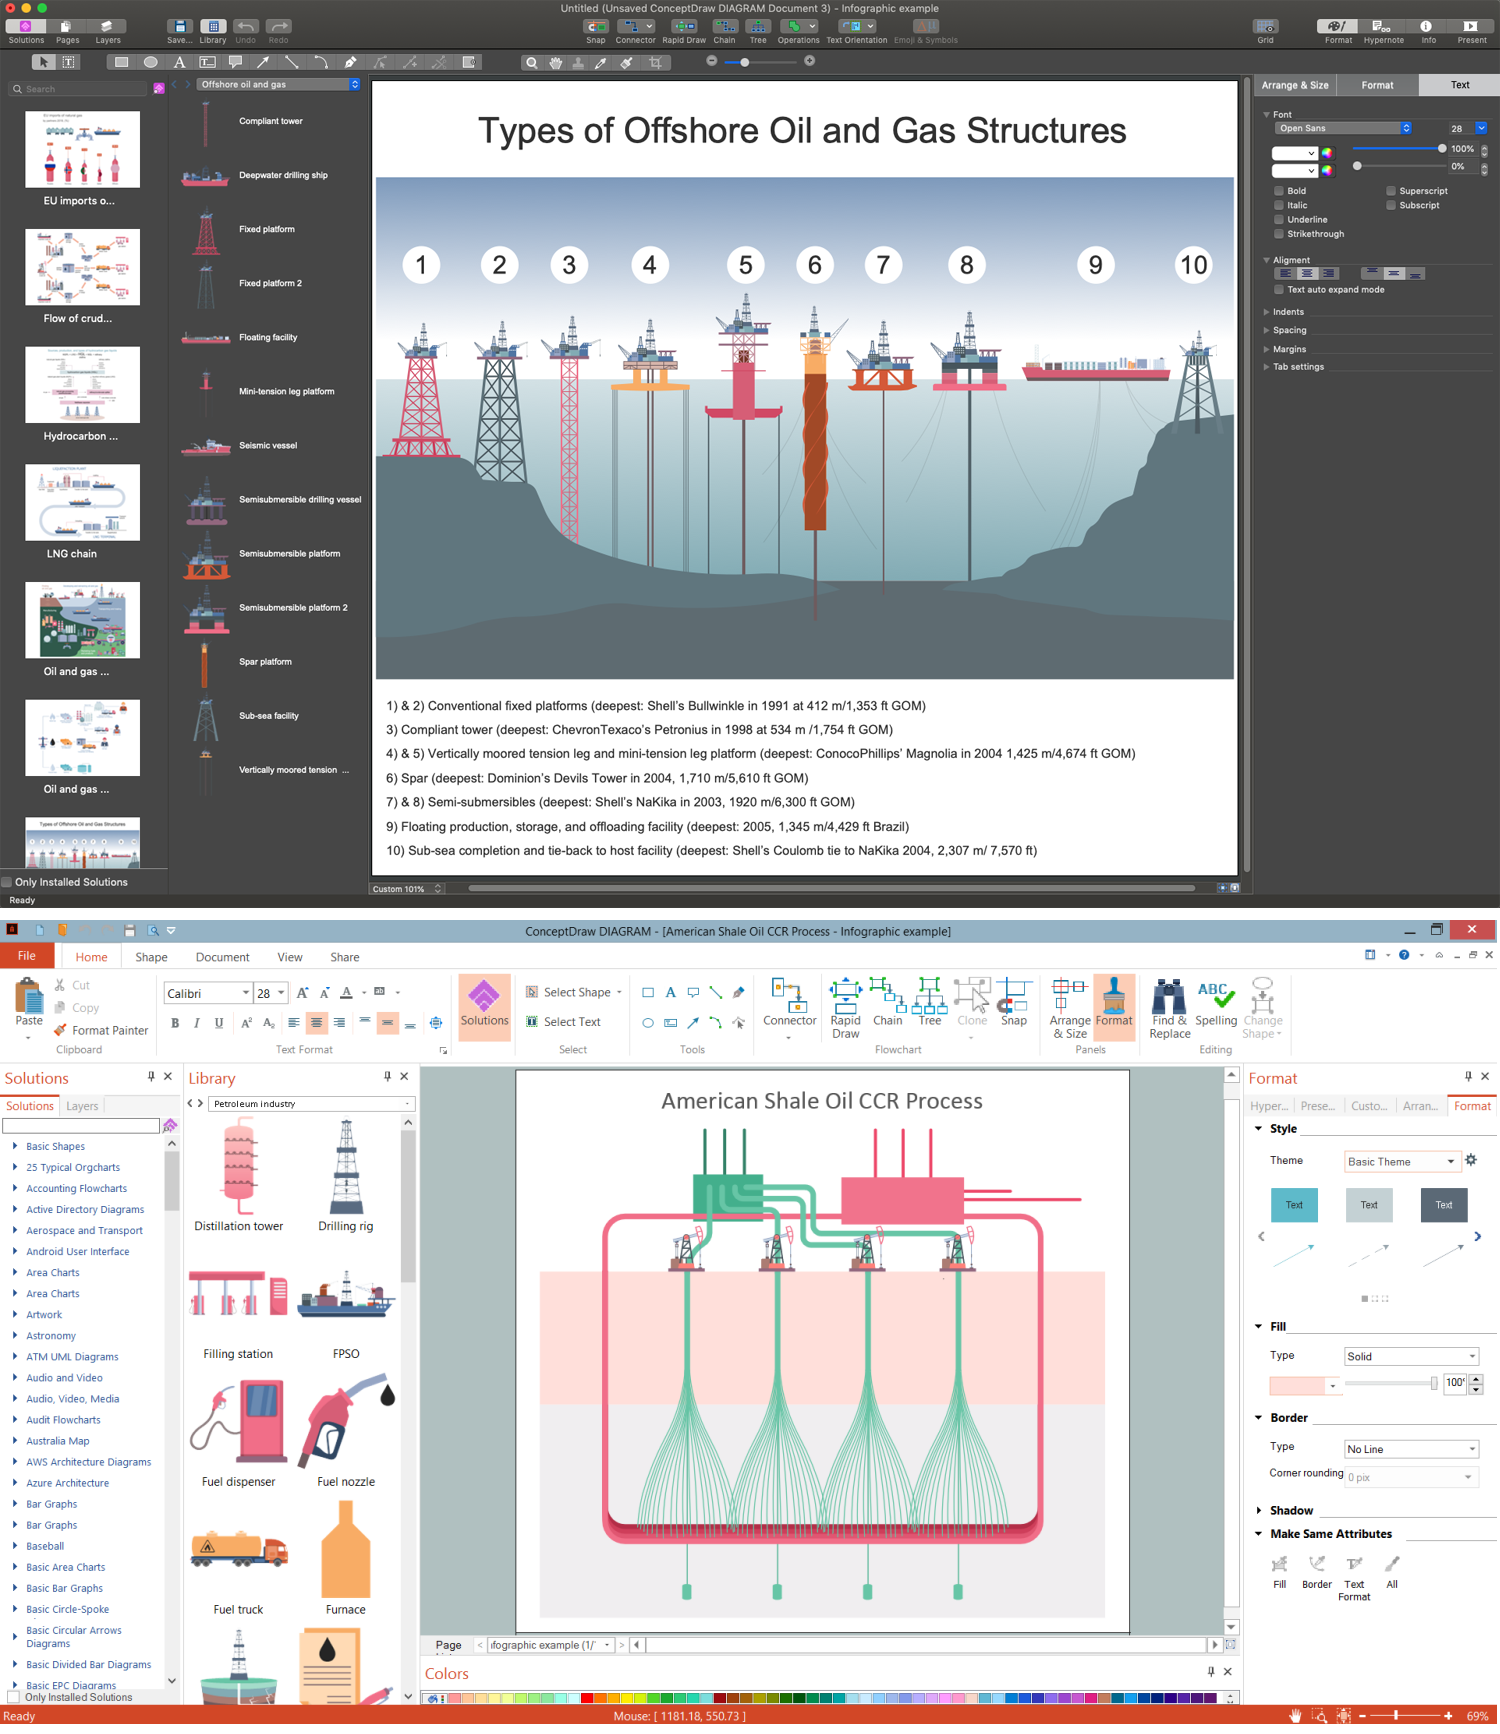
Oil and Gas Industry Infographics
Use the Oil and Gas solution to create appealing and exhaustive oil and gas industry infographics, illustrations, diagrams, schematics. You can start your drawing with one of the samples included in the solution's collection or design in a new document using the pre-made design elements. The resulting illustrations and diagrams are perfect for use in reports on the newest researches and trends in the industry. Involve these infographics to illustrate the scientific materials, official documents, news, videos, articles in professional magazines, websites, blogs, pages on social networks, etc.P&ID Drawing Program
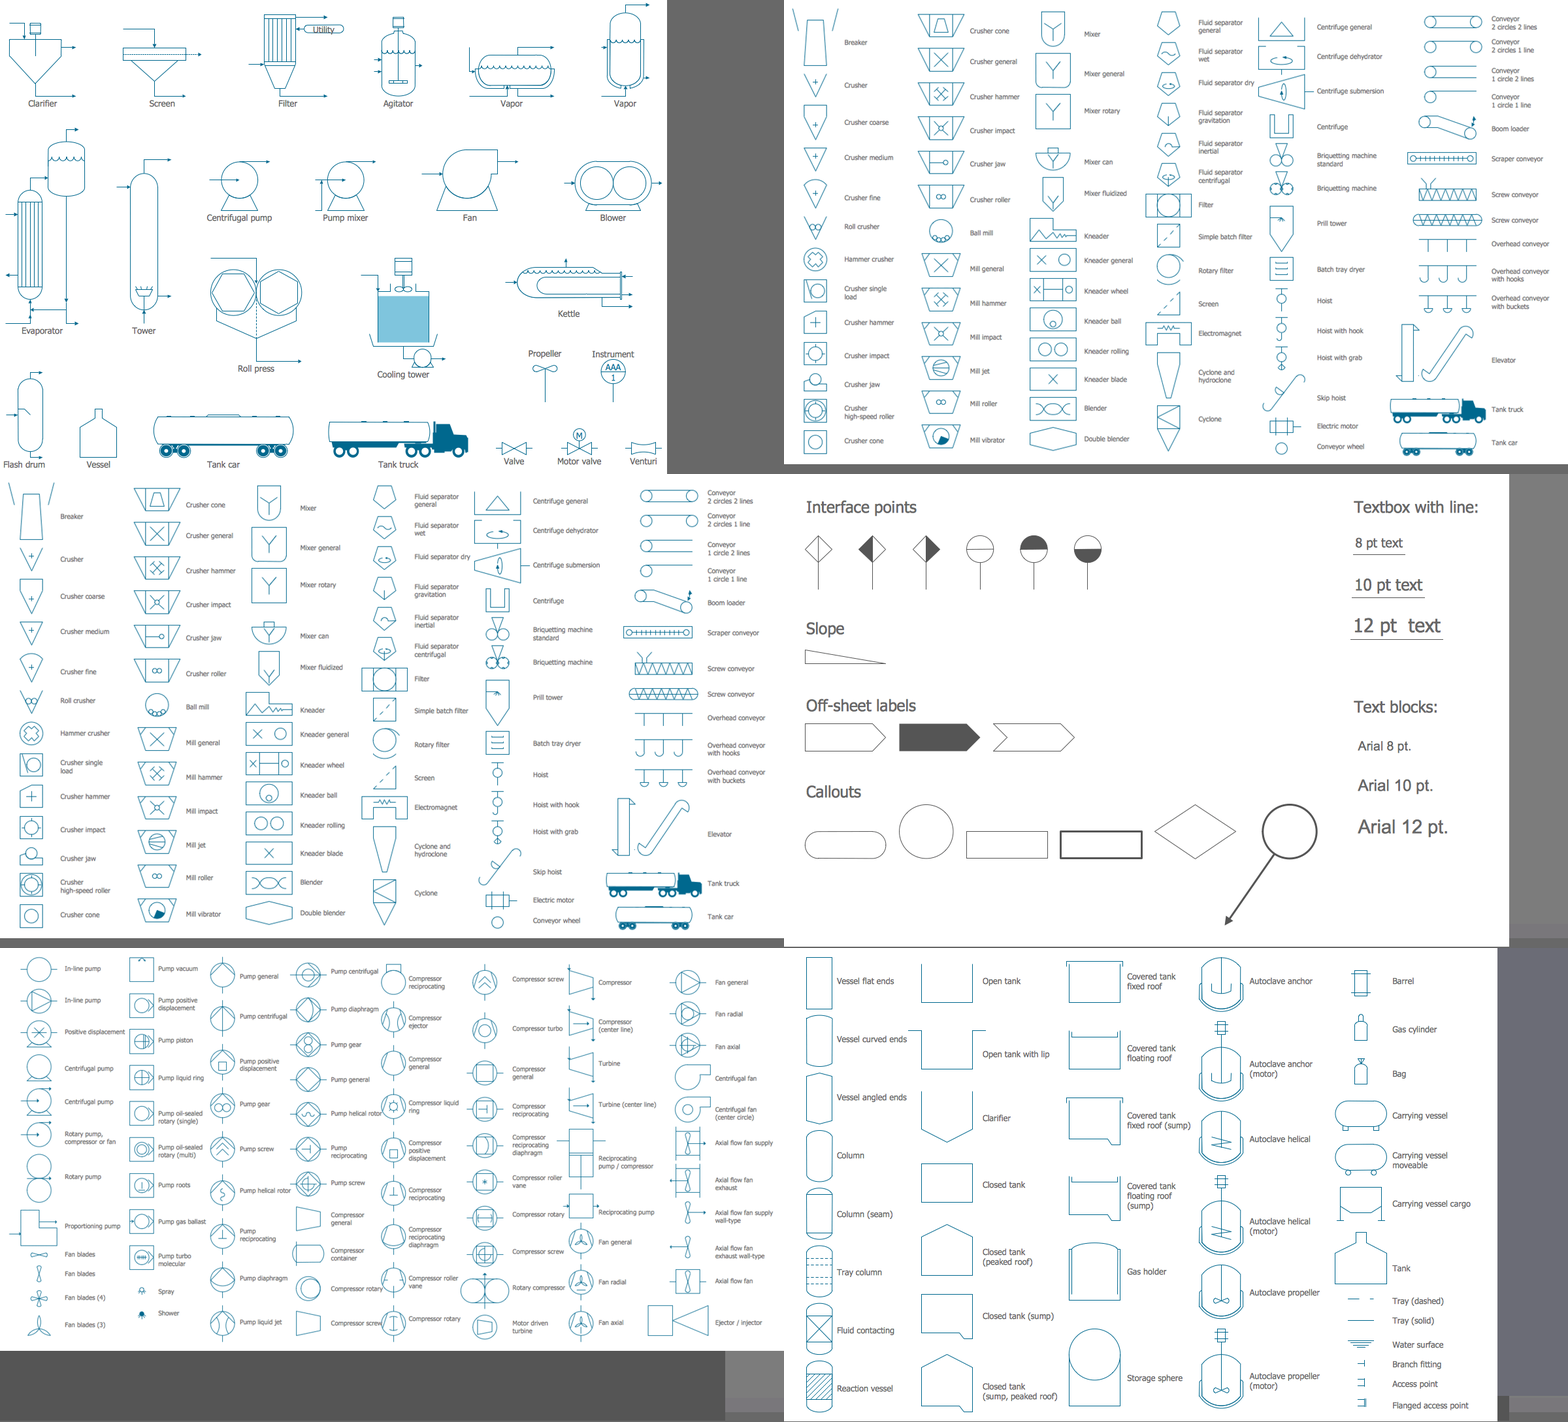
ConceptDraw DIAGRAM with included Chemical and Process Engineering solution is a simple and convenient way to create Piping and Instrumentation Diagrams at the stage of your plant design, planning, construction, and maintenance. It is a streamlined P&ID drawing program for all technical specialists, electrical, mechanical, and process engineers, piping designers, technical developers, and other stakeholders. Accurate design elements help to show the physical sequence of equipment and systems, how the system components are connected with piping, maintain and modify your processes, keep track of basic operational details, and control plant operation easily.Percentage Spider Chart
ConceptDraw PRO creates drawings, diagrams and charts with great visual appeal in Mac OS X. This sample shows the Spider Chart that represents the buyer perceptions of the leather footwear industries in Brazil, India and Italy.Chemical Flow Chart
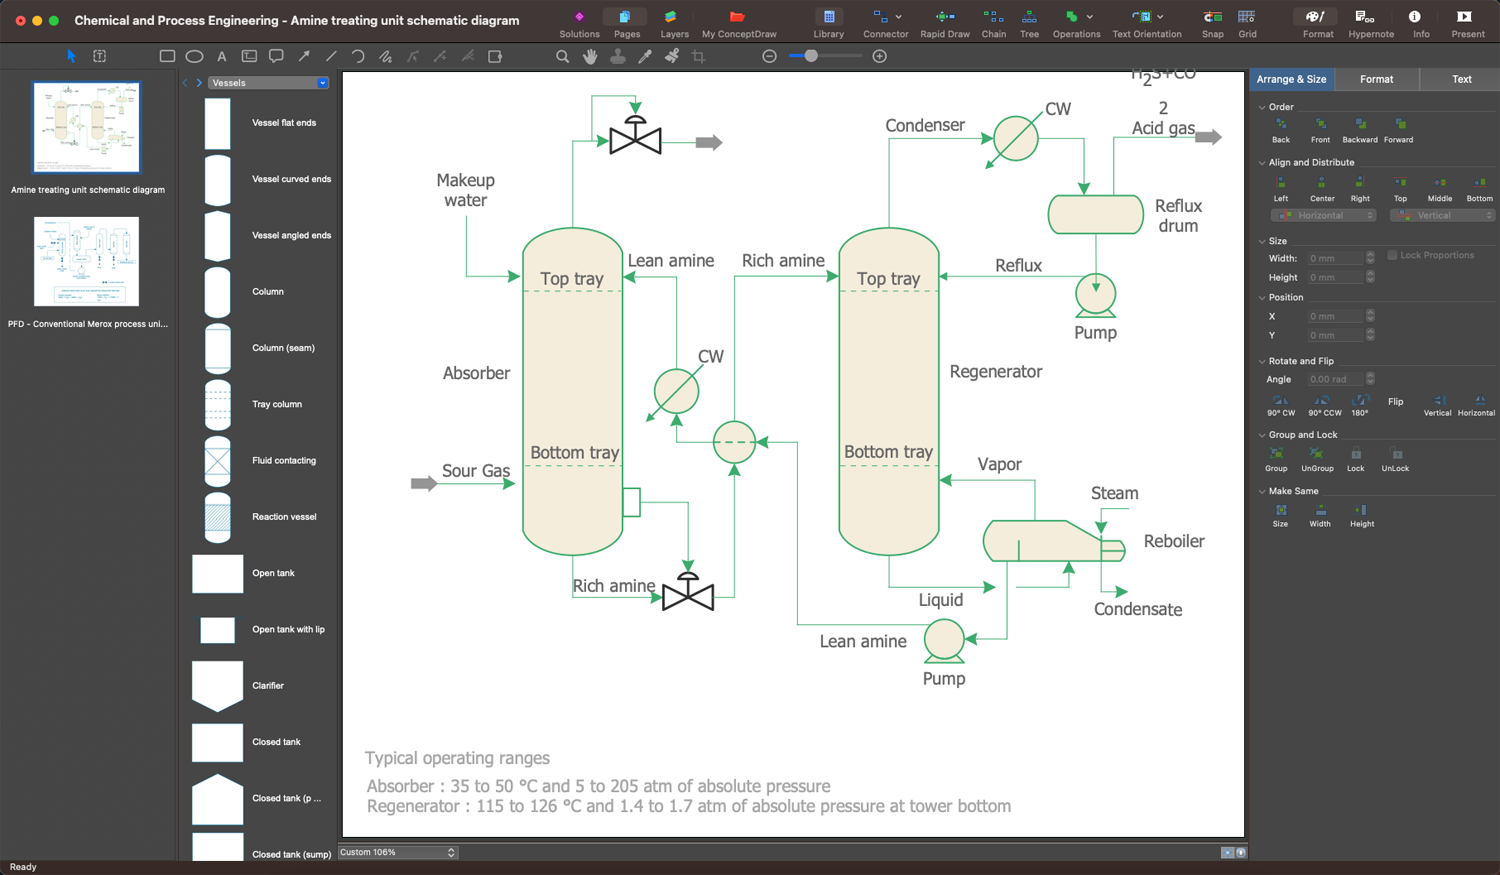
Comprehensible illustration of current workflows provides the possibilities of monitoring and analysis processes in order to improve them and increase the potential of used resources. ConceptDraw DIAGRAM with Chemical and Process Engineering solution included is useful for chemical engineers, process engineers, performance and compliance consultants to create Chemical Flow Chart fast and easy. Design your chemical flow charts efficiently and identify the most reliable and safe solutions to ensure your enterprise's integrity and make it future-proof.Matrix Organization Structure
Matrix organizational structure is one of the main forms of structures which is actively used by organizations to carry forth the functions of a company visually and effectively. Now we have ConceptDraw DIAGRAM diagramming and vector drawing software extended with 25 Typical Orgcharts solution from the Management area of ConceptDraw Solution Park which will help easy represent matrix organizational structure of any degree of complexity.Types of Flowcharts
A Flowchart is a graphical representation of process, algorithm, workflow or step-by-step solution of the problem. It shows the steps as boxes of various kinds and connects them by arrows in a defined order depicting a flow. There are twelve main Flowchart types: Basic Flowchart, Business Process Modeling Diagram (BPMN), Cross Functional Flowchart, Data Flow Diagram (DFD), IDEF (Integrated DEFinition) Flowchart, Event-driven Process Chain (EPC) Diagram, Influence Diagram (ID), Swimlane Flowchart, Process Flow Diagram (PFD), Specification and Description Language (SDL) Diagram, Value Stream Mapping, Workflow Diagram. Using the Flowcharts solution from the Diagrams area of ConceptDraw Solution Park you can easy and quickly design a Flowchart of any of these types. This solution offers a lot of special predesigned vector symbols for each of these widely used notations. They will make the drawing process of Flowcharts much easier than ever. Pay also attention for the included collection of ready Flowchart examples, samples and quick-start templates. This is business process improvement tools. If you are looking for MS Visio for your Mac, then you are out of luck, because it hasn't been released yet. However, you can use Visio alternatives that can successfully replace its functions. ConceptDraw DIAGRAM is an alternative to MS Visio for Mac that provides powerful features and intuitive user interface for the same.
Technical Drawing Software
Technical drawing or draft is a form of specialized graphic communication, exchange of ideas in industry and engineering. It is a visual representation of object with indication of dimensions and used material, constructed with maintaining the proportions between its parts. Technical drawings are constructed by architects, technologists, engineers, designers, drafters, and other technical professionals according to defined rules, specifications, internationally accepted standards and standardized notations allowing to make unambiguous, clear and understandable technical drawings. ConceptDraw DIAGRAM extended with Electrical Engineering solution, Mechanical Engineering solution, Chemical and Process Engineering solution from Industrial Engineering Area of ConceptDraw Solution Park is ideal technical drawing software. Its powerful drawing tools, predesigned vector objects, templates, samples are helpful for creation all kinds of Technical Drawings and Technical Diagrams, Electrical and Mechanical Schematics, Circuit and Wiring Diagrams, Structural Drawings, and many other.Competitor Analysis
Competitor analysis is a first and obligatory step in elaboration the proper corporate marketing strategy and creating sustainable competitive advantage. Use powerful opportunities of numerous solutions from ConceptDraw Solution Park for designing illustrative diagrams, charts, matrices which are necessary for effective competitor analysis.
 Energy Industry Infographics
Energy Industry Infographics solution is ideal for designing energy-related business infographics, diagrams, charts, illustrations for documents and presentations. It provides a set of libraries with special vector energy industry symbols, icons for electrical power industry, nuclear power industry, fossil fuel industry, and renewable energy industry, energy icons of fuel gas, liquid fuel, solid fuel, industry icons of electrical substations, power plants. Collection of samples including nuclear fuel cycle and energy distribution schematics, electrical substation diagram, energy intelligence dashboard, electricity grid schematics, and many more is also included. This solution is indispensable for all engineers, chefs, managers, marketers, and other professionals working in energy industry.
Pictures of Vegetables
Designing of food images, fruit art illustrations, pictures of vegetables, and many other food and cafe related images and infographics has never been easier than it is now with ConceptDraw DIAGRAM software. ConceptDraw DIAGRAM diagramming and vector drawing software extended with Food Court solution from the Food and Beverage area of ConceptDraw Solution Park is perfect food pictures design software.Logic Diagram
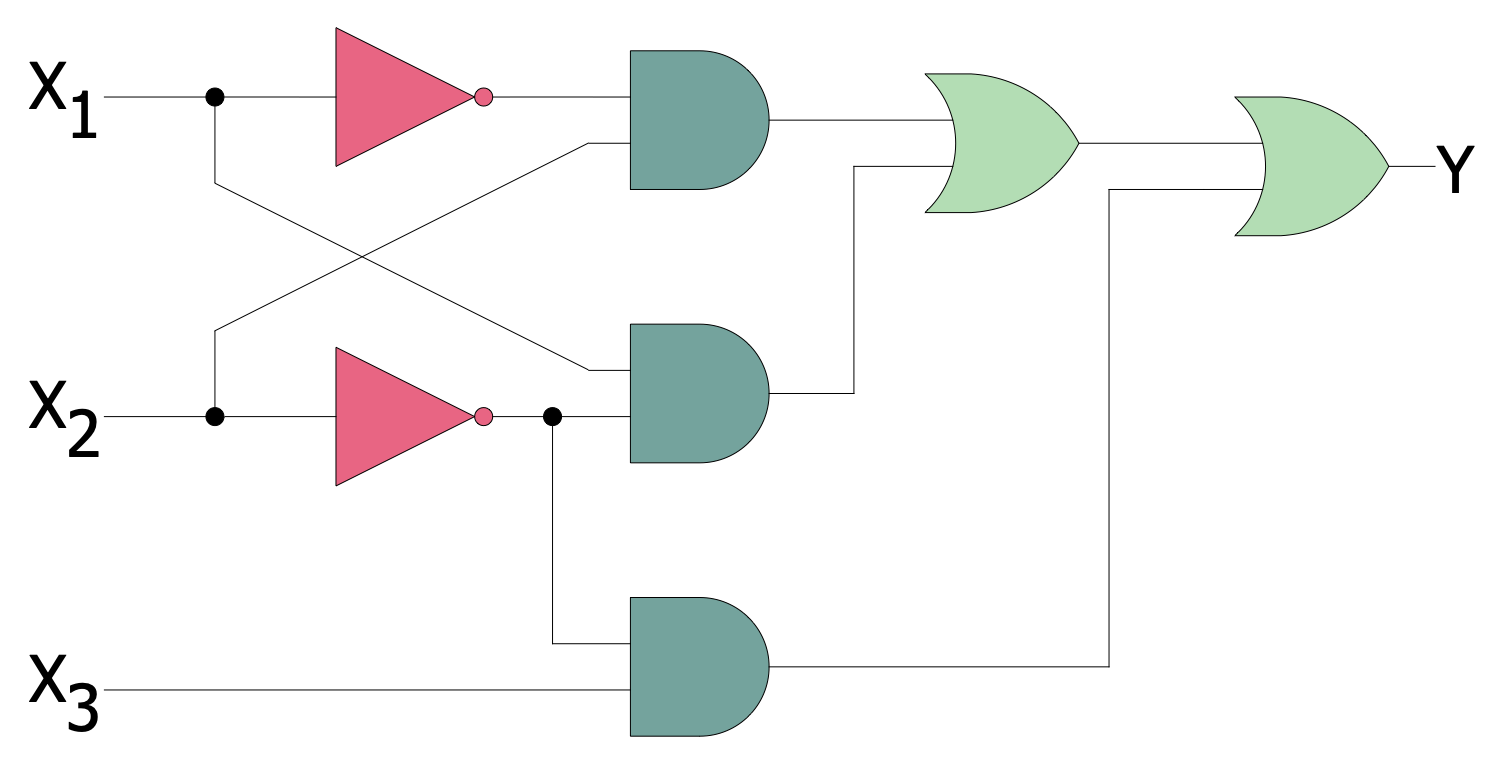
Logic diagrams are the main type of diagrams used to depict logical circuits. They show how the components and logic gates are connected in a digital circuit and allow predicting the expected output according to the included gates. Logic diagrams help receive precise results and avoid financial losses, time wastage, and getting unexpected results. ConceptDraw DIAGRAM software enhanced with Digital Electronics solution includes a collection of pre-made globally recognizable vector elements. They are useful for engineers, electronic designers, facility operators, and technical staff to create efficiently and faster Logic diagrams, Logic circuits, Digital electronic circuits, Computer logic diagrams, Process control logic diagrams.Process Flow Diagram
A Process Flow Diagram (PFD) is a diagram which shows the relationships between the main components in a system. Process Flow Diagrams are widely used by engineers in chemical and process engineering, they allows to indicate the general flow of plant process streams and equipment, helps to design the petroleum refineries, petrochemical and chemical plants, natural gas processing plants, and many other industrial facilities. ConceptDraw DIAGRAM diagramming and vector drawing software extended with powerful tools of Flowcharts Solution from the "Diagrams" Area of ConceptDraw Solution Park is effective for drawing: Process Flow Diagram, Flow Process Diagram, Business Process Flow Diagrams.Circuits and Logic Diagram Software
Circuit diagram is a graphical representation of electrical circuits, wire connections between devices, among them power and signal connections. Circuit diagrams are successfully used during design, construction and maintenance of different electrical and electronic equipment, and also for visualizing expressions using a boolean algebra in the computer science. These diagrams don't show a physical arrangement of components. One of advanced application of ConceptDraw DIAGRAM software is electrical engineering. Included to ConceptDraw Solution Park, Electrical Engineering solution from the Engineering area offers templates, samples and incredibly large quantity of vector design elements of circuits and logic symbols, which are helpful for professional drawing Circuit diagrams, Logic circuit diagrams, Wiring diagrams, Electrical schematics, Digital and Analog logic designs, Integrated circuit schematics, Circuit board and Amplifier diagrams, Power systems diagrams, Maintenance and Repair diagrams of any difficulty."A piping and instrumentation diagram/ drawing (P&ID) is a diagram in the process industry which shows the piping of the process flow together with the installed equipment and instrumentation. ...
P&IDs play a significant role in the maintenance and modification of the process that it describes. It is critical to demonstrate the physical sequence of equipment and systems, as well as how these systems connect. During the design stage, the diagram also provides the basis for the development of system control schemes, allowing for further safety and operational investigations, such as a Hazard Analysis and Operability Study...
For processing facilities, it is a pictorial representation of:
Key piping and instrument details,
Control and shutdown schemes,
Safety and regulatory requirements,
Basic start up and operational information." [Piping and instrumentation diagram. Wikipedia]
The piping and instrumentation diagram template for the ConceptDraw PRO diagramming and vector drawing software is included in the Chemical and Process Engineering solution from the Engineering area of ConceptDraw Solution Park.
Process Engineering
ConceptDraw DIAGRAM diagramming and vector drawing software supplied with Chemical and Process Engineering Solution from the Industrial Engineering Area of ConceptDraw Solution Park is powerful and effective process engineering software.
 Education Package
Education Package is a comprehensive set of multifarious graphical solutions from ConceptDraw Solution Park, collected together in help to ConceptDraw DIAGRAM users working in a field of science, education and training, which is aimed at improving the quality of education and helping to design with ease variety of interesting and colorful educational materials, diagrams, charts and maps. Use it to present the information and knowledge in an interesting, clear, structured and simple form to achieve a success in education and pedagogy, to maintain the interest of students and pupils throughout the whole learning process, at the lectures, lessons and even during independent work with additional materials, to contribute to better perception of scientific information by listeners during the conferences and reports.
 Basic Circle-Spoke Diagrams
Basic Circle-Spoke Diagrams solution makes ConceptDraw DIAGRAM the best software for creating the Circle-Spoke Diagrams, Circle Diagrams, and Spoke Diagrams. It offers the library of vector stencils, the set of illustrative samples and gives the introduction about what is a circle spoke diagram or what is a spoke diagram. Use any of included samples as a circle spoke diagram template to design a professionally-looking Circle Spoke Diagram of any complexity literally in a few moments and use it in business documentation, report or simply share with colleagues.
- Process Flow Diagram Symbols | Process Flowchart | Chemical ...
- Process Flowchart | Flowchart Maker | Industry Standard Symbols
- Engineering | Pneumatic Ciruit Diagram Mechnical Industry
- Process Flow Diagram Symbols | Chemical Engineering | How to ...
- Chemical Engineering | Process Flow Diagram Symbols | Technical ...
- How to Draw Pictorial Chart. How to Use Infograms | Workflow ...
- Mechanical Engineer Symbol With Graphic
- Process Flowchart | Process Chart Symbols In Industrial Engineering
- Chemical Engineering | Best Vector Drawing Application for Mac OS ...
- Process Flowchart | Industrial Relations Diagrams


-piping-and-instrumentation-diagram-template.png--diagram-flowchart-example.png)
