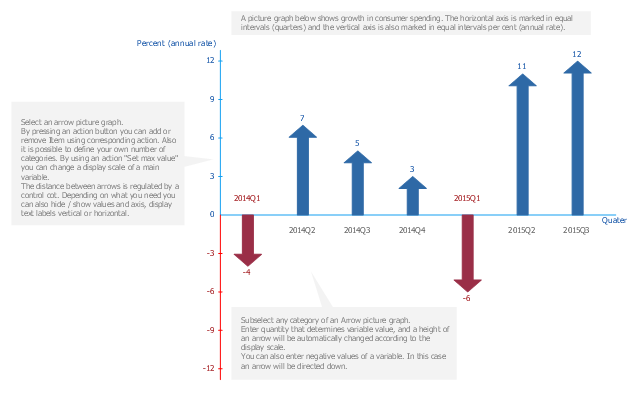
A picture chart (image chart, pictorial graph) is the type of a bar graph visualizing numarical data using symbols and pictograms.
In the field of economics and finance use a picture graph with columns in the form of coins. For population comparison statistics use a chart with columns in the form of manikins. To show data increase or decrease use arrows bar charts.
The arrow chart template "Picture graph" for the ConceptDraw PRO diagramming and vector drawing software is included in the Basic Picture Graphs solution from the Graphs and Charts area of ConceptDraw Solution Park.
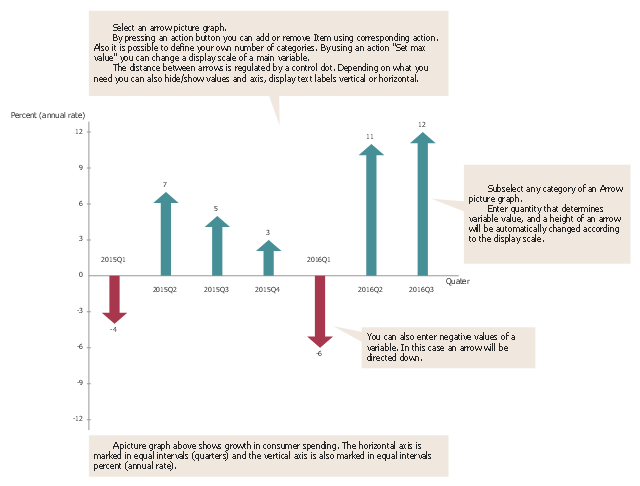
A picture chart (image chart, pictorial graph) is the type of a bar graph visualizing numarical data using symbols and pictograms.
In the field of economics and finance use a picture graph with columns in the form of coins. For population comparison statistics use a chart with columns in the form of manikins. To show data increase or decrease use arrows bar charts.
The picture graph template for the ConceptDraw PRO diagramming and vector drawing software is included in the Picture Graphs solution from the Graphs and Charts area of ConceptDraw Solution Park.
Picture Graph
A Picture Graph is a popular and widely used type of a bar graph, which represents data in various categories using the pictures. ConceptDraw DIAGRAM extended with Picture Graphs solution from the Graphs and Charts area of ConceptDraw Solution Park is the best software for fast and simple drawing professional looking Picture Graphs.The vector stencils library "Picture Graphs" contains 4 image chart templates. Use it to design your pictorial bar charts in ConceptDraw PRO diagramming and vector drawing software.
"Pictorial bar graph.
Sometimes reffered to as a pictographs. A pictorial bar graph is a graph in which the rectangular bars have been filled with pictures, sketches, icons, etc. or where pictures, sketches, icons, etc. have been substituted for the rectangular bars. In both variations, one or more symbols might be used in each bar. The two major reasons for using pictorial graphs are to make the graph more appealing visually and to facilitate better communications." [Information Graphics: A Comprehensive Illustrated Reference. R. L. Harris. 1999. p.41]
The chart templates example "Design elements - Picture graphs" is included in the Basic Picture Graphs solution from the Graphs and Charts area of ConceptDraw Solution Park.
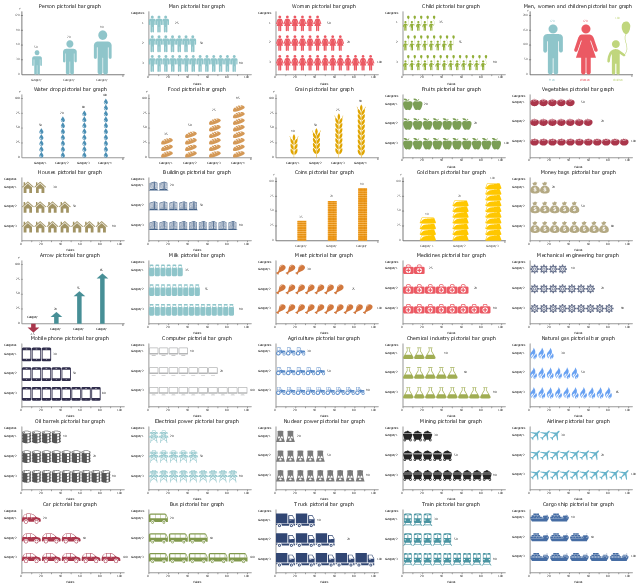
The vector stencils library "Picture Graphs" contains 35 templates of picture bar graphs for visual data comparison and time series.
Drag a template from the library to your document, set bars number, type category labels, select bars and enter your data.
Use these shapes to draw your pictorial bar charts in the ConceptDraw PRO diagramming and vector drawing software.
The vector stencils library "Picture Graphs" is included in the Picture Graphs solution from the Graphs and Charts area of ConceptDraw Solution Park.
The vector stencils library "Picture bar graphs" contains 35 templates of pictorial charts. Use it for visualization of data comparison and time series with ConceptDraw PRO diagramming and vector drawing software.
"Pictorial bar graph.
Sometimes reffered to as a pictographs. A pictorial bar graph is a graph in which the rectangular bars have been filled with pictures, sketches, icons, etc. or where pictures, sketches, icons, etc. have been substituted for the rectangular bars. In both variations, one or more symbols might be used in each bar. The two major reasons for using pictorial graphs are to make the graph more appealing visually and to facilitate better communications." [Information Graphics: A Comprehensive Illustrated Reference. R. L. Harris. 1999. p.41]
The pictorial charts example "Design elements - Picture bar graphs" is included in the Picture Graphs solution from the Graphs and Charts area of ConceptDraw Solution Park.
 Picture Graphs
Typically, a Picture Graph has very broad usage. They many times used successfully in marketing, management, and manufacturing. The Picture Graphs Solution extends the capabilities of ConceptDraw DIAGRAM with templates, samples, and a library of professionally developed vector stencils for designing Picture Graphs.
A picture chart (image chart, pictorial graph) is the type of a bar graph visualizing numarical data using symbols and pictograms.
In the field of economics and finance use a picture graph with columns in the form of coins. For population comparison statistics use a chart with columns in the form of manikins. To show data increase or decrease use arrows bar charts.
The arrow chart template "Picture graph" for the ConceptDraw PRO diagramming and vector drawing software is included in the Basic Picture Graphs solution from the Graphs and Charts area of ConceptDraw Solution Park.
What Is a Picture Graph?
What is a Picture Graph? It's one of the most useful way which allows explain the information, statistical data in a visual form using the pictures. ConceptDraw DIAGRAM extended with Picture Graphs solution from the Graphs and Charts area offers you the easiest way of Picture Graphs drawing.Pictures of Graphs
ConceptDraw DIAGRAM diagramming and vector drawing software extended with Picture Graphs solution from the Graphs and Charts Area is the best choice for making professional looking pictures of graphs and colorful picture graphs.Financial Comparison Chart
This sample shows the Bar Chart of the leverage ratios for two major investment banks. The leverage ratio is the ratio of the total debt to the total equity; it is a measure of the risk taken by the bank. The higher of the leverage ratio denotes the more risk, the greater risks can lead to the subprime crisis.Pie Graph Worksheets
Pie Graph is very popular kind of charts which is widely used in various fields of science and life activities. ConceptDraw DIAGRAM extended with Pie Charts Solution from the Graphs and Charts area is the best software for drawing the Pie Graph Worksheets.
 Basic Picture Graphs
This solution extends the capabilities of ConceptDraw DIAGRAM (or later) with templates, samples and a library of vector stencils for drawing Picture Graphs.
Create Graphs and Charts
Charting Software allows you to create diagrams, charts, graphs, flowcharts, and other business graphics. ConceptDraw DIAGRAM include simple shape drawing tools, examples, templates, and symbol libraries.Line Graph
ConceptDraw DIAGRAM extended with Line Graphs solution from Graphs and Charts area of ConceptDraw Solution Park is ideal software for quick and simple drawing professional looking line graph.Bar Charts
ConceptDraw DIAGRAM diagramming and vector drawing software extended with Bar Graphs solution from the Graphs and Charts area of ConceptDraw Solution Park is ideal for drawing the Bar Charts fast and simply.Percentage Pie Chart. Pie Chart Examples
This sample was created in ConceptDraw DIAGRAM diagramming and vector drawing software using the Pie Charts Solution from Graphs and Charts area of ConceptDraw Solution Park. This sample shows the Pie Chart of the approximate air composition. You can see the percentage of oxygen, nitrogen and other gases in the air visualized on this Pie Chart.Bar Graph
You need to draw the Bar Graph? The automated tool can be useful for you. ConceptDraw DIAGRAM diagramming and vector drawing software extended with Bar Graphs solution from Graphs and Charts area of ConceptDraw Solution Park will help you create any Bar Graph.ConceptDraw DIAGRAM - Organizational chart software
Organizational Chart is a scheme which visualizes the composition of departments, sectors and other functional units of an organization, and also fixed relationships that exist between divisions and employees. ConceptDraw DIAGRAM enhanced with Organizational Charts solution is a powerful and cost effective Organizational chart software, which allows to automate the process of creation the high standard organizational charts, flow charts, time lines, and much more diagrams. It can be applied for analyzing organizational structure and drawing single or multi-page Organizational Charts with hyperlinks for the companies of any type, size and direction. Visualize the structure using the orgchartal tools, create easily as never before the Company Organizational Chart, Corporate Organizational Chart, Hospital Organizational Chart, University Organizational Chart, Hotel Organizational Chart, and then export, send by e-mail or publish it on Web in minutes, to communicate and discuss with colleagues or any other interested people.What Is a Line Chart
What Is a Line Chart? A line chart is a basic type of chart represented by a series of data points connected with a straight line. Explaining the meaning of “What is a line chart?” is convenient to use illustrations with professional looking line charts designed in ConceptDraw DIAGRAM diagramming and vector drawing software extended with Line Graphs solution from the Graphs and Charts area.- Picture graph - Template
- Picture Graph | Picture Graphs | Picture graph - Template | Types Of ...
- Gantt chart examples | Chart Maker for Presentations | What Is a ...
- Design elements - Picture graphs | Picture graph - Template | Picture ...
- Picture graph - Template | Manufacturing in America | Total value of ...
- Normal distribution graph - Template | Double bar graph - Template ...
- Normal distribution graph - Template | Picture Graphs | Competitor ...
- Barrie population - Picture bar graph | Picture Graphs | Picture graph ...
- Arrow circle chart - Template | Picture graph - Template | Education ...
- Design elements - Picture bar graphs | Picture Graph Or Pictograph
- Design elements - Picture graphs | How to Draw Pictorial Chart. How ...
- Design elements - Picture bar graphs | Picture Graphs | Picture ...
- Barrie population - Picture bar graph | Design elements - Picture bar ...
- Design elements - Picture bar graphs | Picture graphs - Vector ...
- Picture Graphs | Pie Chart Word Template . Pie Chart Examples | Bar ...
- Bar Graphs | Sales Growth. Bar Graphs Example | Picture Graphs ...
- Picture Graphs | Competitor Analysis | What Is a Picture Graph ...
- How to Create a Picture Graph in ConceptDraw PRO | Design ...
- A Picture Of A Block Graph


