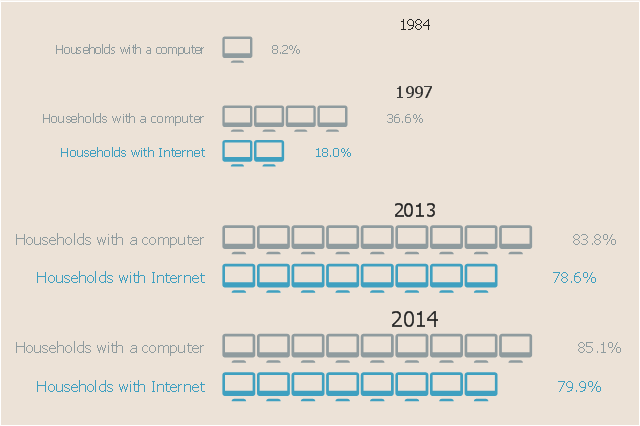
This picture bar graph sample shows the computer and Internet use at home from 1984 to 2014. It was designed using data from website of the United States Census Bureau (USCB).
[census.gov/ content/ dam/ Census/ library/ visualizations/ 2016/ comm/ digital_ nation.png]
"Home automation is the residential extension of building automation and involves the control and automation of lighting, heating, ventilation, air conditioning (HVAC), appliances, and security. Modern systems generally consist of switches and sensors connected to a central hub sometimes called a "gateway" from which the system is controlled with a user interface that is interacted either with a wall-mounted terminal, mobile phone software, tablet computer or a web interface." [Home automation. Wikipedia]
The pictorial chart example "Computer and Internet use at home over time" was created using the ConceptDraw PRO diagramming and vector drawing software extended with the Picture Graphs solution from the Graphs and Charts area of ConceptDraw Solution Park.
The vector stencils library "Picture Graphs" contains 35 templates of picture bar graphs for visual data comparison and time series.
Drag a template from the library to your document, set bars number, type category labels, select bars and enter your data.
Use these shapes to draw your pictorial bar charts in the ConceptDraw PRO diagramming and vector drawing software.
The vector stencils library "Picture Graphs" is included in the Picture Graphs solution from the Graphs and Charts area of ConceptDraw Solution Park.
 Picture Graphs
Typically, a Picture Graph has very broad usage. They many times used successfully in marketing, management, and manufacturing. The Picture Graphs Solution extends the capabilities of ConceptDraw DIAGRAM with templates, samples, and a library of professionally developed vector stencils for designing Picture Graphs.
Network Diagram Examples
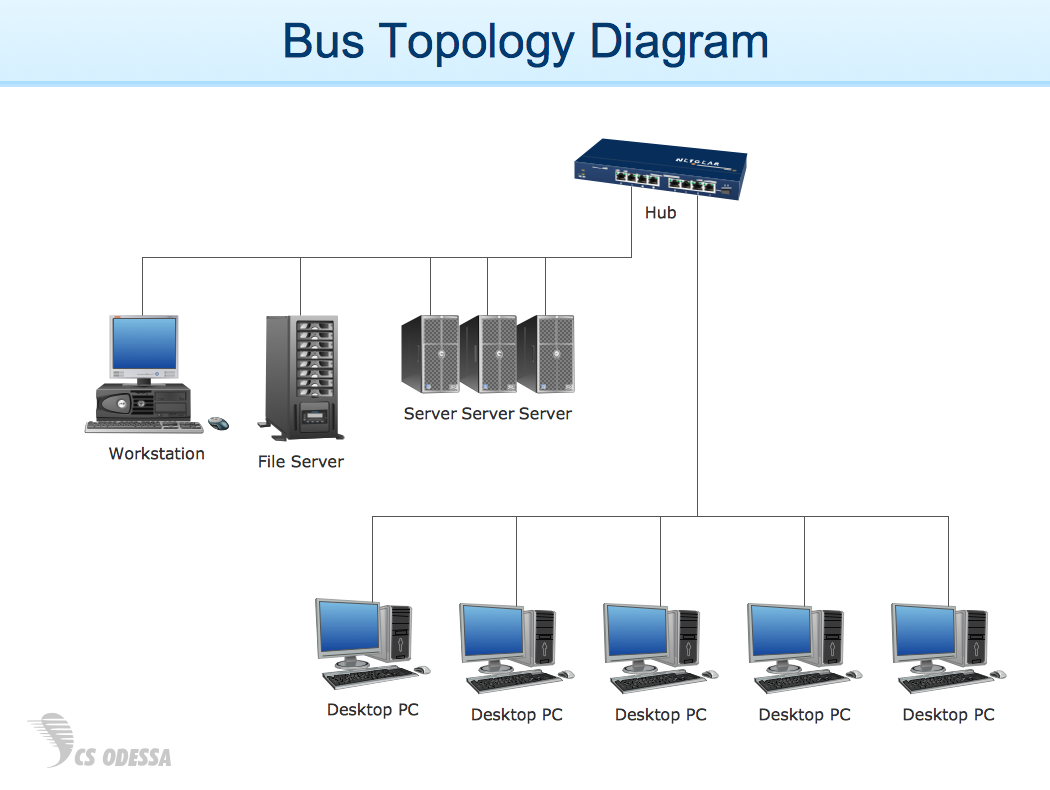
Network diagram is a chart which represents nodes and connections between them in computer network or any telecommunication network, it is a visual depiction of network architecture, physical or logical network topology. There are used common icons for the Network diagrams design, such as icons of various network appliances, computer devices, routers, clouds, peripheral devices, digital devices, etc. Network diagrams can represent networks of different scales (LAN level, WAN level) and detailization. ConceptDraw DIAGRAM diagramming software enhanced with Computer Network Diagrams solution from Computer and Networks area includes huge collection of computer and network templates, design objects and stencils, and numerous quantity of Network diagram examples and samples, among them: Basic Computer Network Diagrams, Communication Network Diagram, Wireless Router Network Diagram, LAN Topology Diagram, Computer Network System Design Diagram, Mobile Satellite Communication Network, Web-based Network Diagram, Hybrid Network Diagram, and many others.
 Bar Graphs
The Bar Graphs solution enhances ConceptDraw DIAGRAM functionality with templates, numerous professional-looking samples, and a library of vector stencils for drawing different types of Bar Graphs, such as Simple Bar Graph, Double Bar Graph, Divided Bar Graph, Horizontal Bar Graph, Vertical Bar Graph, and Column Bar Chart.
- Bar Graph Images
- Design elements - Picture bar graphs | Picture graphs - Vector ...
- Picture Graphs | Picture Graph | How to Create a Picture Graph in ...
- Bar Graph On Food
- Picture Graph | Picture Graphs | How to Create a Picture Graph in ...
- Design elements - Picture bar graphs | Barrie population - Picture ...
- Home area networks (HAN). Computer and Network Examples ...
- Design elements - Picture bar graphs | Picture graphs - Vector ...
- Basic Diagramming | How to Create a Picture Graph in ...
- Picture graph - Template | Picture Graph | Chart Maker for ...
- Picture graphs - Vector stencils library | Management indicators ...
- Bar Graph | Picture graphs - Vector stencils library | Sales Growth ...
- Design elements - Picture bar graphs | Picture Graph | What Is a ...
- Regional population growth from 2010 to 2016 | Competitor Analysis ...
- Internet Connectivity. Computer and Network Examples | Internet ...
- Picture graphs - Vector stencils library | Design elements - Picture ...
- Horizontal Bar Graph Infographic
- Basic Flowchart Images . Flowchart Examples | Image chart - The ...
- Design elements - Picture bar graphs | Picture Graph | Pictures of ...
- Picture Graphs


