HelpDesk
How to Connect an Image to a Topic in Your Mind Map
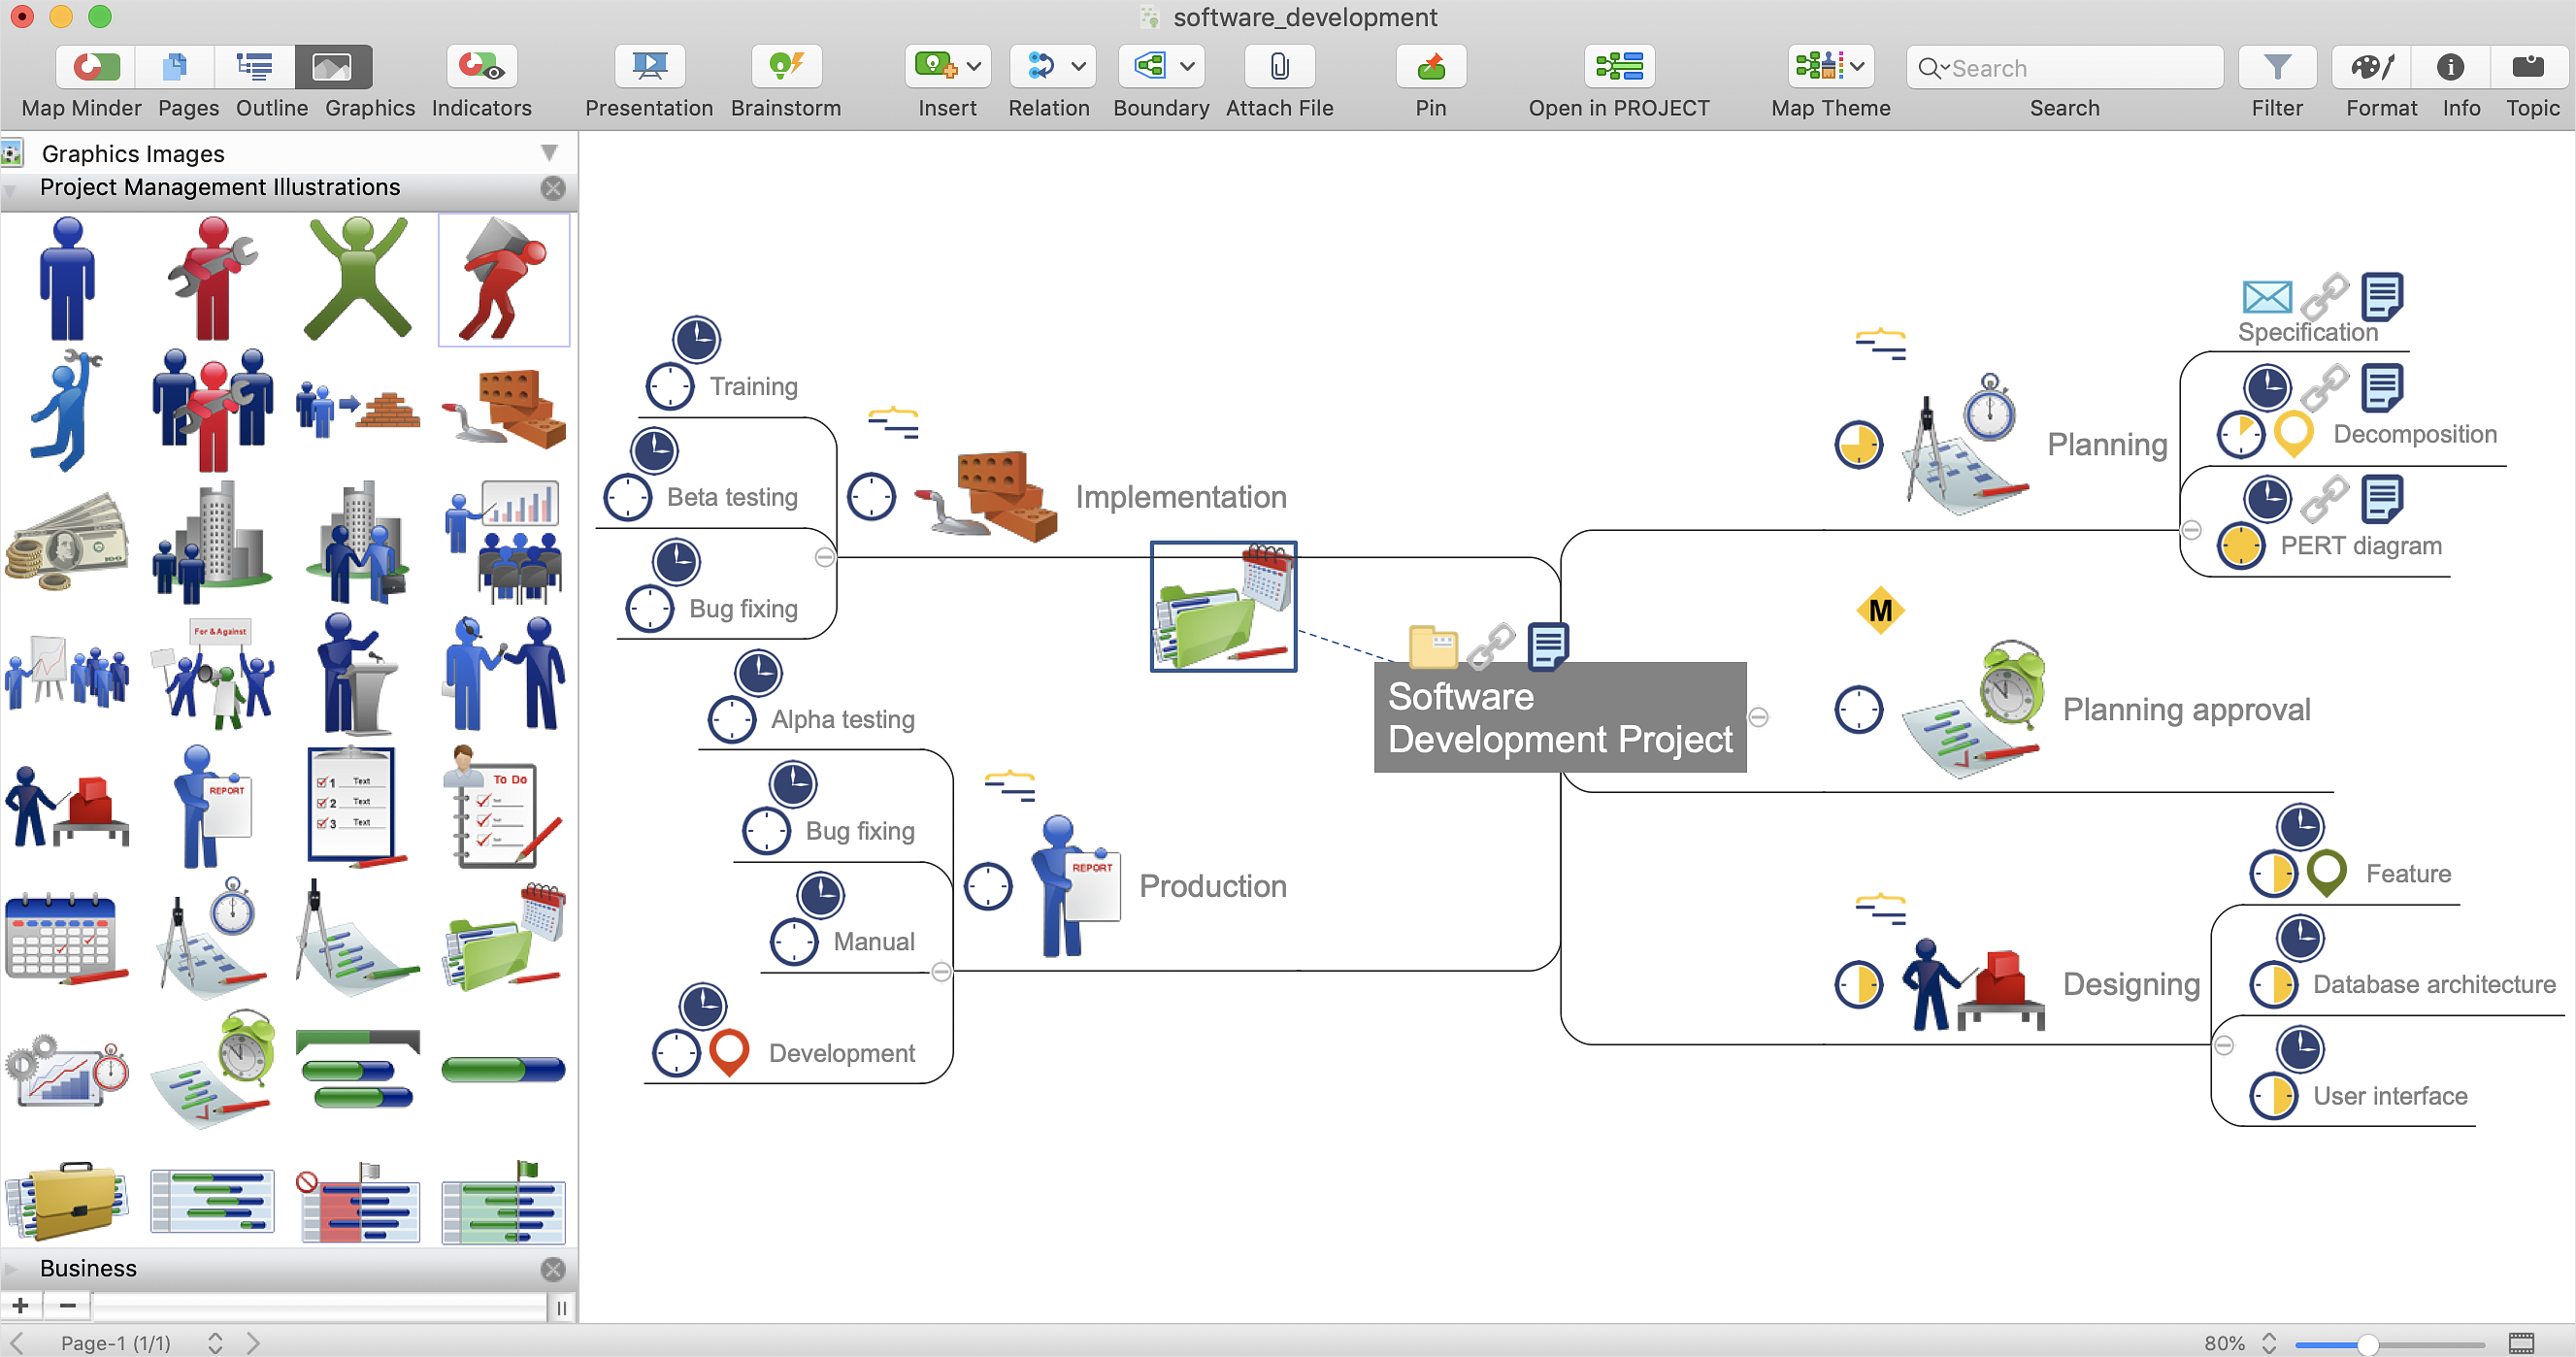
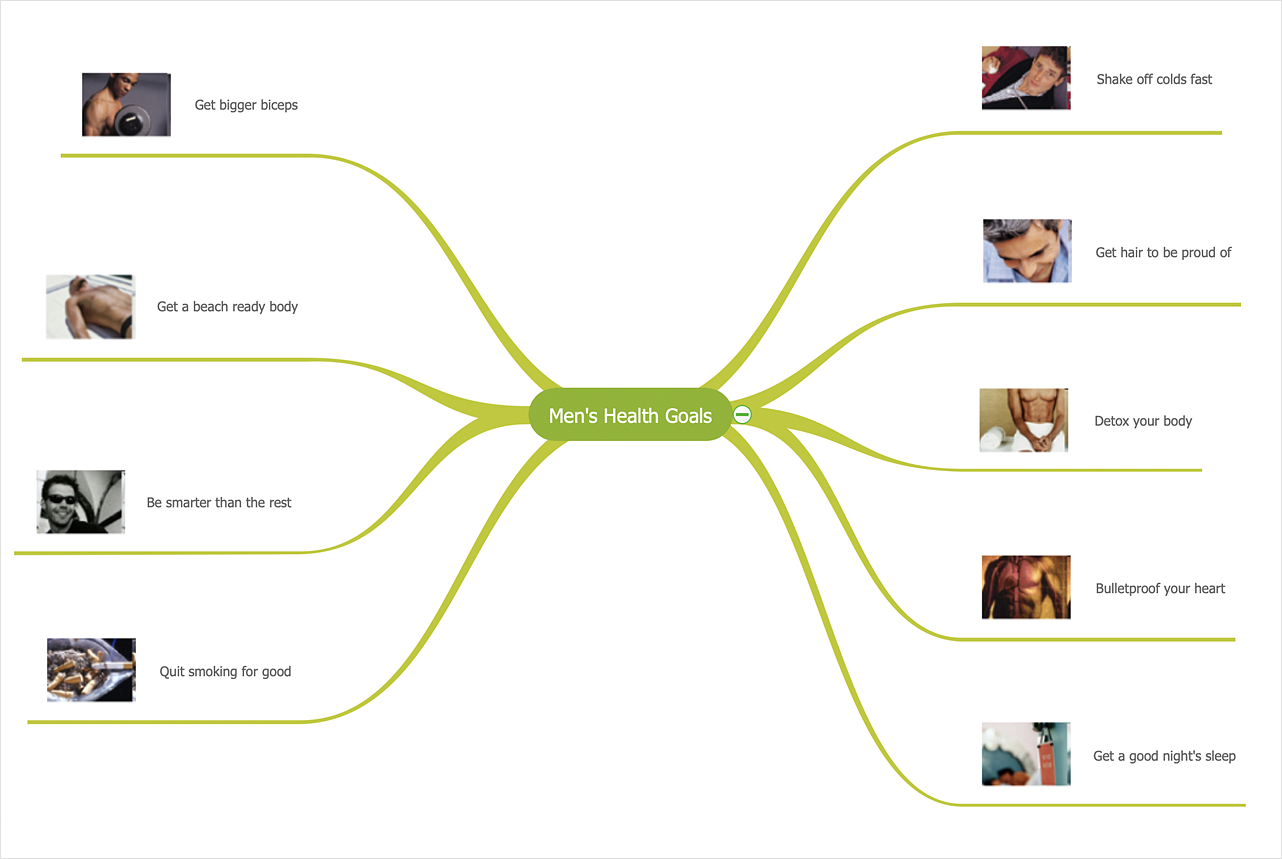
There is nothing easier than adding images to your mind map. Images can add creativity and functionality, and give your map a distinct style. ConceptDraw MINDMAP has a Graphics panel containing a clip art gallery so you can easily incorporate pictures into your maps making them even more memorable and intuitive. You can add images to any part of your mind map.HelpDesk
How to Support Your Mind Map with Visual Elements
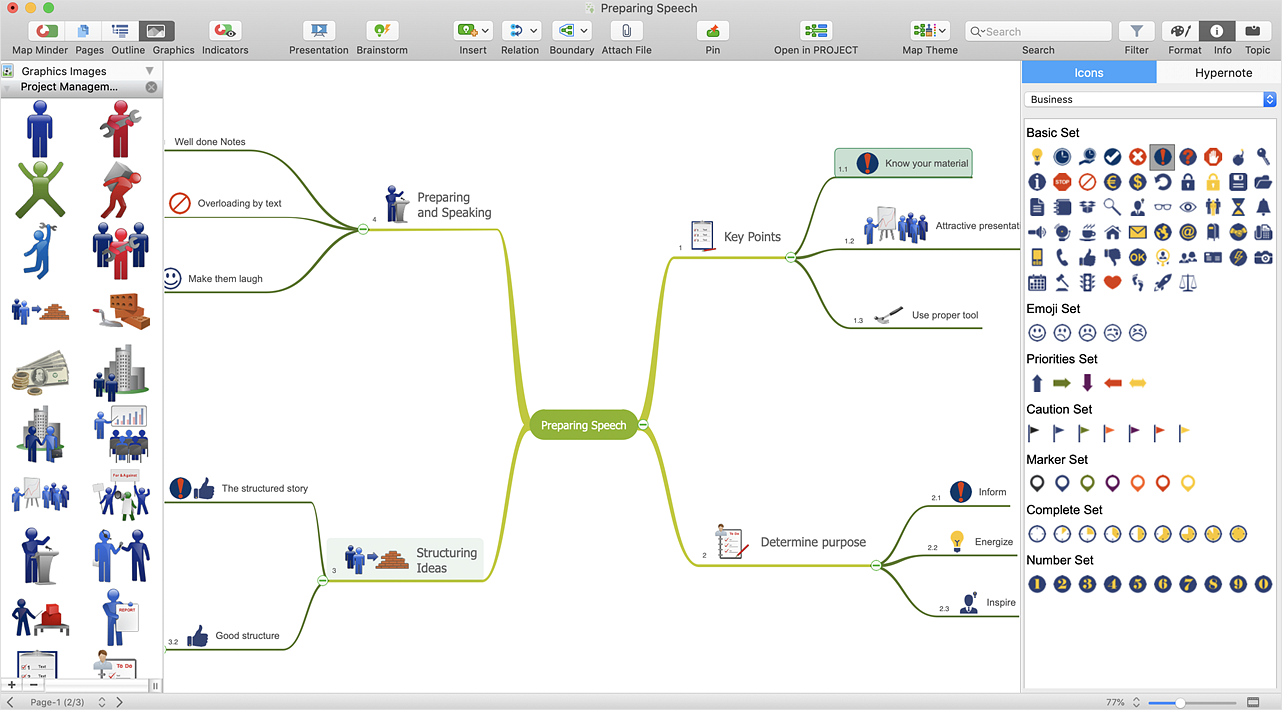
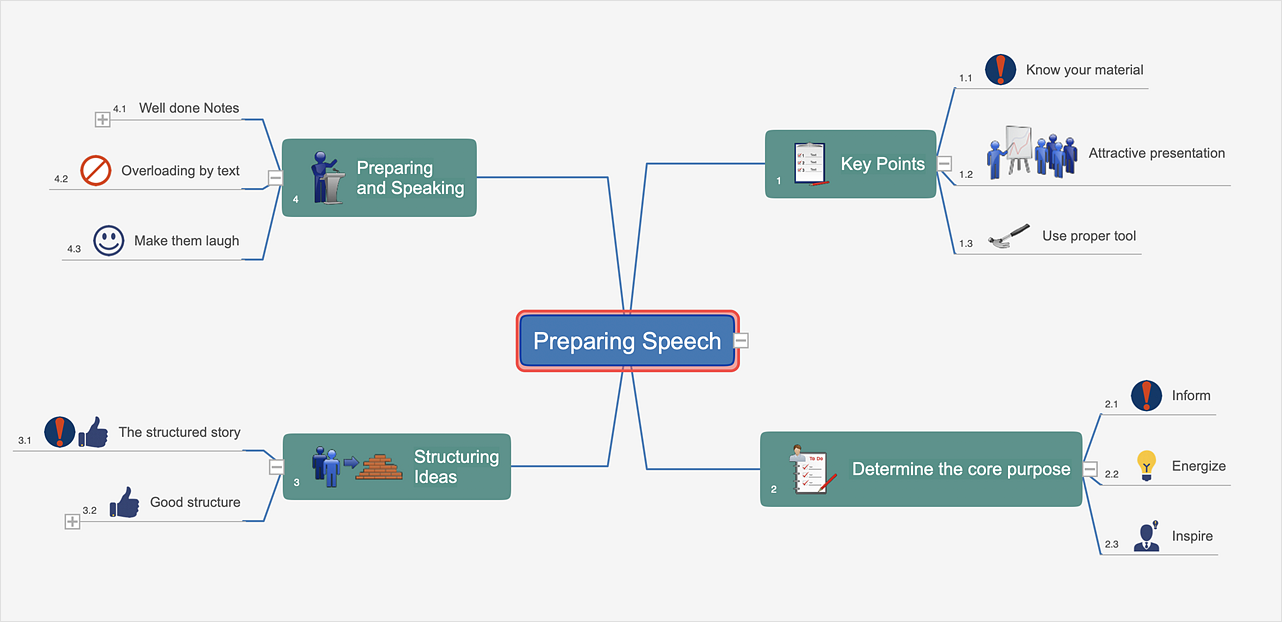
Symbols and images that you can add to ideas in your mind map help to extend the meaning and add context to topics. These visual elements can be used to depict priority, types of actions (phone calls, meetings, emails, etc), and kinds of information or ideas. You can easily incorporate images and symbols into your mind maps making them even more memorable and brain friendly.
 Picture Graphs
Typically, a Picture Graph has very broad usage. They many times used successfully in marketing, management, and manufacturing. The Picture Graphs Solution extends the capabilities of ConceptDraw DIAGRAM with templates, samples, and a library of professionally developed vector stencils for designing Picture Graphs.
 USA Maps
Use the USA Maps solution to create a map of USA, a US interstate map, printable US maps, US maps with cities and US maps with capitals. Create a complete USA states map.
 ConceptDraw Solution Park
ConceptDraw Solution Park collects graphic extensions, examples and learning materials
HelpDesk
How to Create a Custom Library
Why do people use custom clip art to create their mind maps? First, this allows you to create your author's style. Making a mind map is a creative work, and each mind map depicts the personality of its author. More, the custom clip art is needed if your mind map often contains the same set of custom images that are not supplied with the standard software package. ConceptDraw MINDMAP allows you to create a custom clip art library to increase the visual capacity of your mind maps. You can even deploy them inside ConceptDraw MINDMAP so that you can use them through standard interface tools.
 Value Stream Mapping
Value stream mapping solution extends ConceptDraw DIAGRAM software with templates, samples and vector stencils for drawing the Value Stream Maps (VSM) in lean manufacturing practice.
HelpDesk
How to Operate a Multiple Main Idea on Your Mind Map
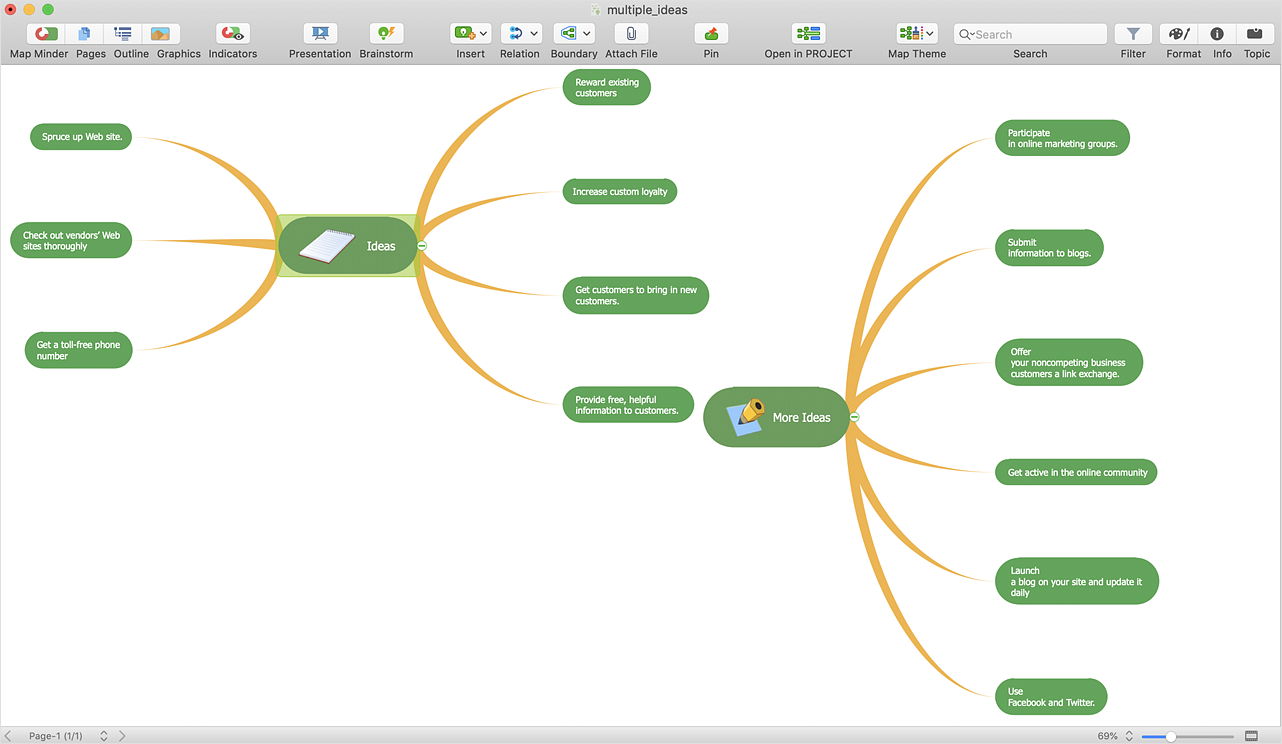
If you are using multiple Main Ideas your maps, it is necessary to know that there is a difference in behavior between the original primary Main Idea and the other Ideas you add.
 Food Court
Use the Food Court solution to create food art. Pictures of food can be designed using libraries of food images, fruit art and pictures of vegetables.
HelpDesk
How to Customize the Default Map Theme
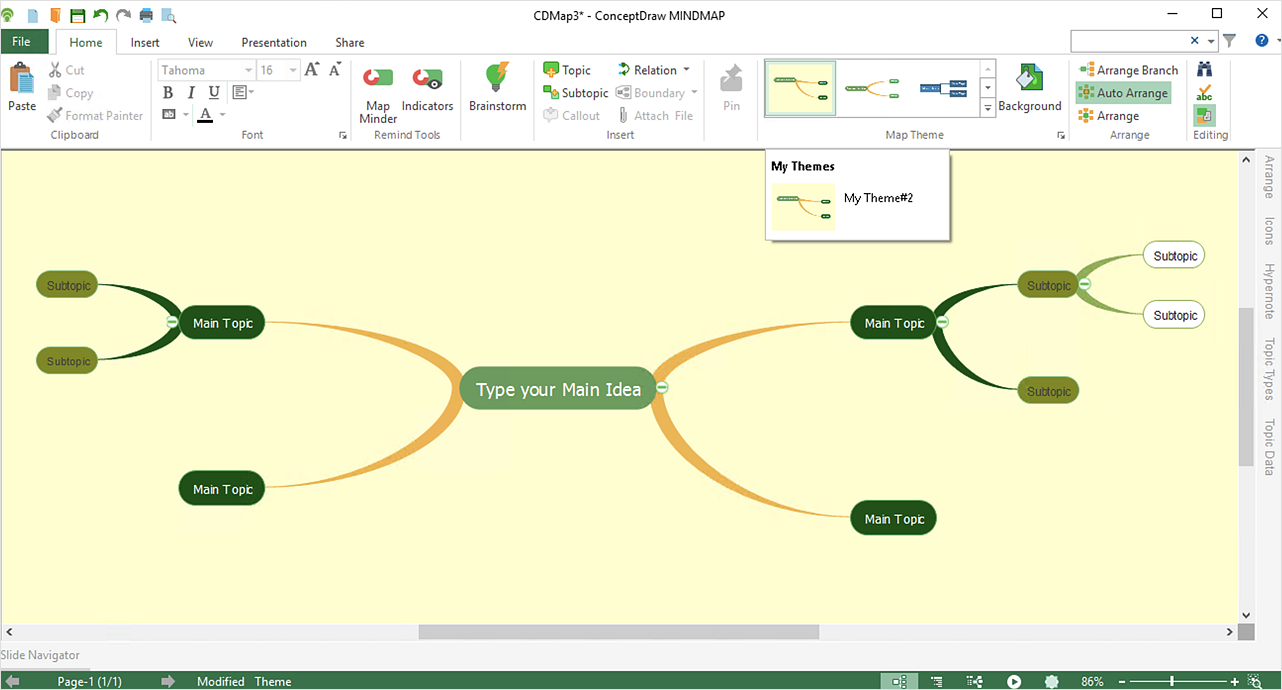
ConceptDraw MINDMAP allows you to customize all kinds of visual aspects of your mind maps, including the style of topic lines of the default theme for new maps.
 Astronomy
Astronomy solution extends ConceptDraw DIAGRAM software with illustration and sketching software with templates, samples and libraries of a variety of astronomy symbols, including constellations, galaxies, stars, and planet vector shapes; a whole host of cele
HelpDesk
How to Create a Picture Graph
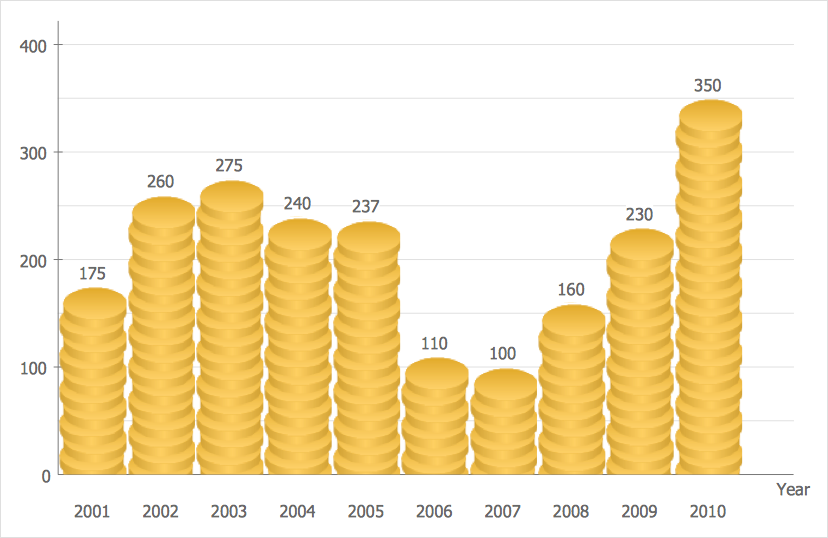
Picture Graphs are used commonly to represent non-complex data to a large audience. A Picture Graph is a simple kind of marketing diagram used to show the relationship among various quantities. It includes pictures or symbols to represent information visually. There are many cases when you have just some numbers to show and compare. This is not a reason to not use visual tools. You can produce a simple picture graph using memorable symbols to get the best visual presentation. Using specific symbols instead of regular colored bars makes picture graphs a much more descriptive tool. You can use tools from an existing library or find appropriate clipart in ConceptDraw’s collection. ConceptDraw DIAGRAM allows you to draw a simple and easy to understand Picture Charts using the special library.Geo Map — United States of America Map
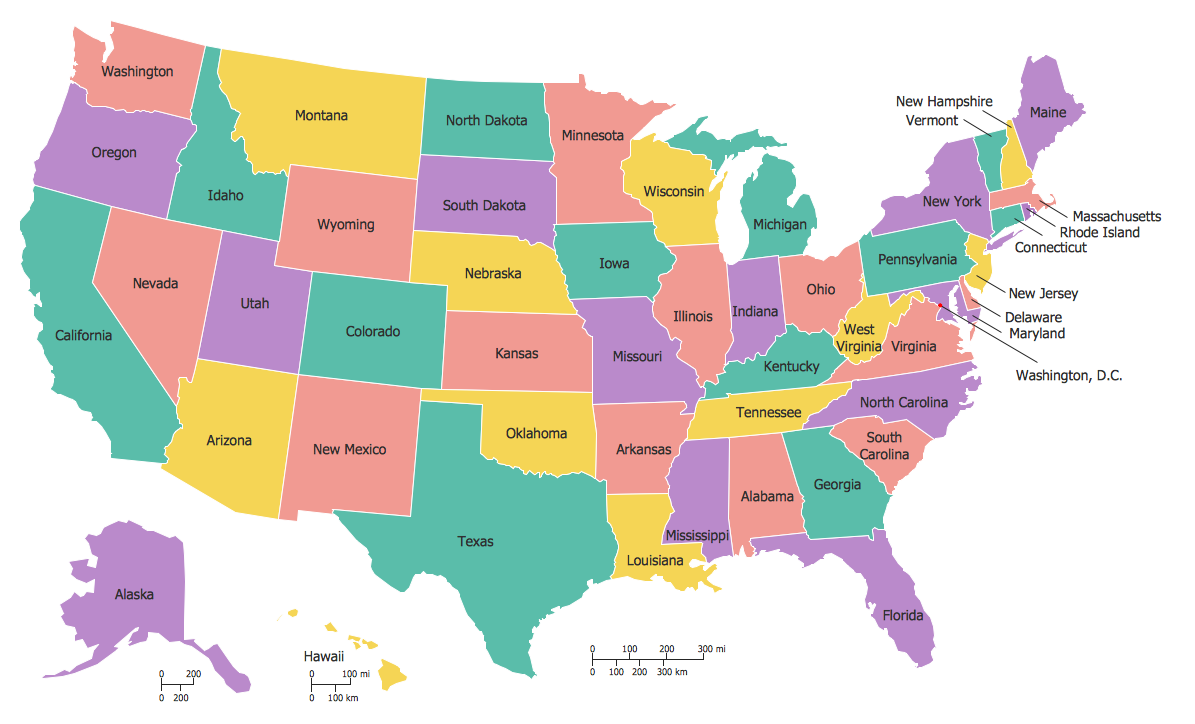
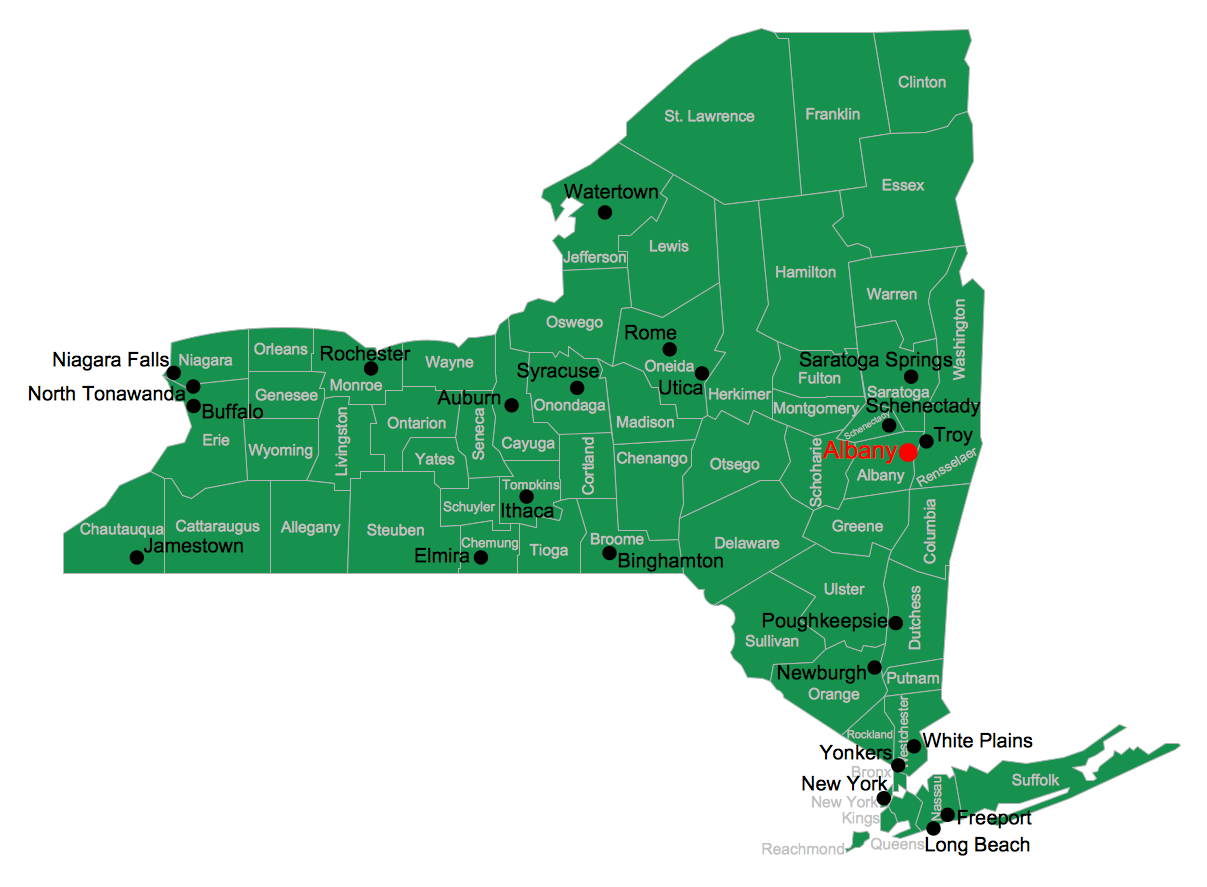
United States of America (USA) is a federal republic that includes 50 states and a federal district. It is the third largest country by population, fourth by the total area, and one of the most diverse in respect of nationalities and cultures. ConceptDraw DIAGRAM software extended with Continent Maps solution is ideal to draw professional looking Geological map of United States of America, USA map with states, the separate maps of different states of America, thematic maps, geospatial infographics, and varied vector illustrations for your business documents, presentations and websites. Use the pre-designed vector geo map shapes offered by numerous libraries, in particular by the United States of America library that contains 53 United States of America map contours. Each map is scaled, with the option to add the further levels of detail, thus the county borders, their names, capitals, and major cities can be instantly shown or hidden using the Action menu for each state map. ConceptDraw DIAGRAM software gives you a full control over the map size, shading, color fills and alignment.
 Computer Network Diagrams
Computer Network Diagrams solution extends ConceptDraw DIAGRAM software with samples, templates and libraries of vector icons and objects of computer network devices and network components to help you create professional-looking Computer Network Diagrams, to plan simple home networks and complex computer network configurations for large buildings, to represent their schemes in a comprehensible graphical view, to document computer networks configurations, to depict the interactions between network's components, the used protocols and topologies, to represent physical and logical network structures, to compare visually different topologies and to depict their combinations, to represent in details the network structure with help of schemes, to study and analyze the network configurations, to communicate effectively to engineers, stakeholders and end-users, to track network working and troubleshoot, if necessary.
HelpDesk
How to Customize the Style of Your Mind Map
Tips on how to modify or create your own mind map theme and then use it for a new map?HelpDesk
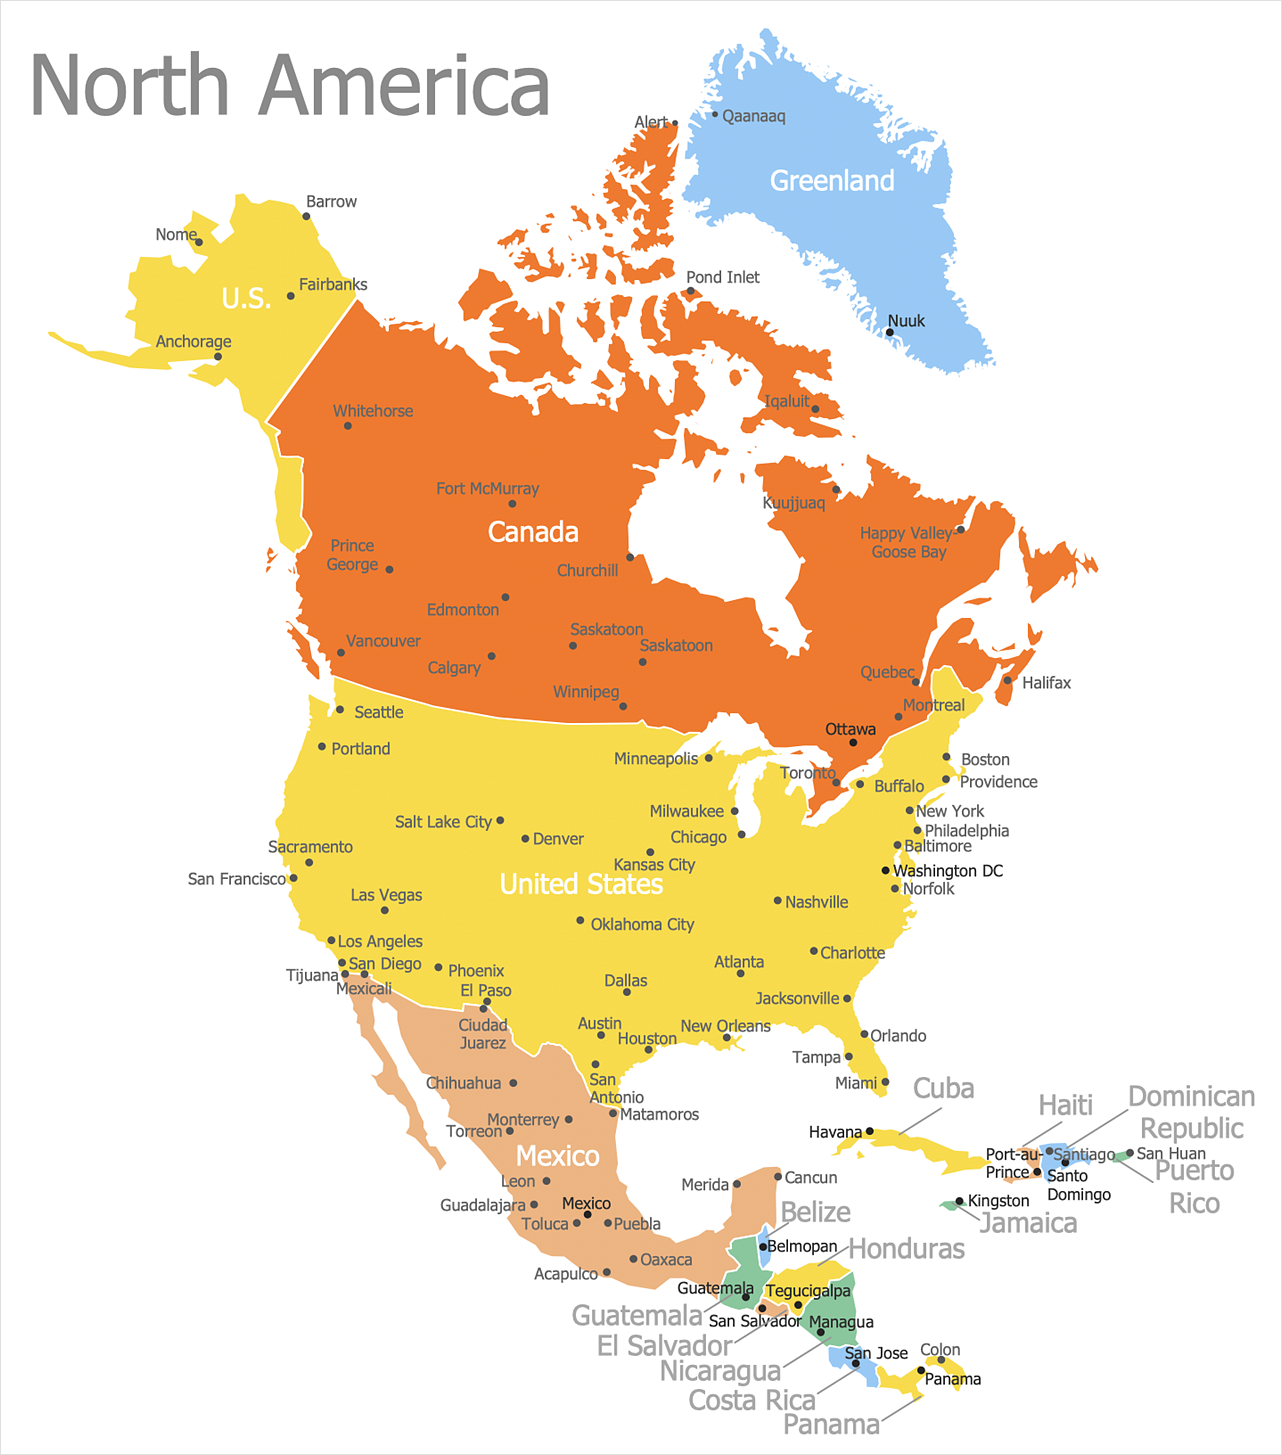
How to Draw a Map of North America
Geographic maps, cardiograms, and thematic maps are often used for geographical visualization of business information. Any country can inspire a wealth of geopolitical statistical data. A common way of assimilating this data is to create maps that convey a particular theme or subject matter in relation to a specific geographical area. Known as thematic maps, they cover themes such as population density, average rainfall, or political allegiance, differentiating the data by using graphical elements and annotation. Thematic maps contrast general reference maps, which tend to display information on a variety of subjects — vegetation, topology, roads, and highways, for example. A thematic map will always focus on one particular subject matter. ConceptDraw DIAGRAM can be helpful as a tool for creating maps of countries and regions of the world. It allows you to draw continental maps quickly and easily using the special templates and vector stencils libraries.
 Basketball
The Basketball Solution extends ConceptDraw DIAGRAM.5 (or later) software with samples, templates, and libraries of vector objects for drawing basketball diagrams, plays schemas, and illustrations. It can be used to make professional looking documents, pre
USA Map
Usually designing of maps, including the USA Map is a quite complex, long and labour-intensive process. But now we have an excellent possibility to make it easier with ConceptDraw DIAGRAM diagramming and vector drawing software extended with powerful USA Maps Solution from the Maps Area of ConceptDraw Solution Park.- Picture graph - Population growth by continent, 2010 - 2013 ...
- USA Maps | Circle-Spoke Diagrams | Area Charts | Diagram ...
- Continent Maps | Geo Map - South America Continent | Continent ...
- America Maps Images
- Pictures of Graphs | Line Chart Examples | Picture Graphs | Example ...
- Line Chart Examples | Population growth by continent, 2010 - 2013 ...
- Picture graph - Population growth by continent, 2010 - 2013 | Basic ...
- Population growth by continent, 2010 - 2013 - Picture graph ...
- Picture graph - Population growth by continent, 2010 - 2013 | Picture ...
- Geo Mapping Software Examples - World Map Outline | Design ...
- Continent Maps | Europe flags - Stencils library | Map Software ...
- Universal Diagramming Area | Maps | How to Draw a Natural ...
- Area chart - San Francisco population history | Geo Map - USA ...
- World Population Infographics | Sample Pictorial Chart Sample ...
- ConceptDraw Solution Park | Geo Map Software | Continent Maps ...
- Picture graph - Population growth by continent, 2010 - 2013 | Area ...
- Geo Map - South America Continent | Continent Maps | Geo Map of
- Geo Mapping Software Examples - World Map Outline | 2014 FIFA ...
- Geo Map - America
- Continent Maps
