Winter Sports. Olympic Games Infographics. Medal Table
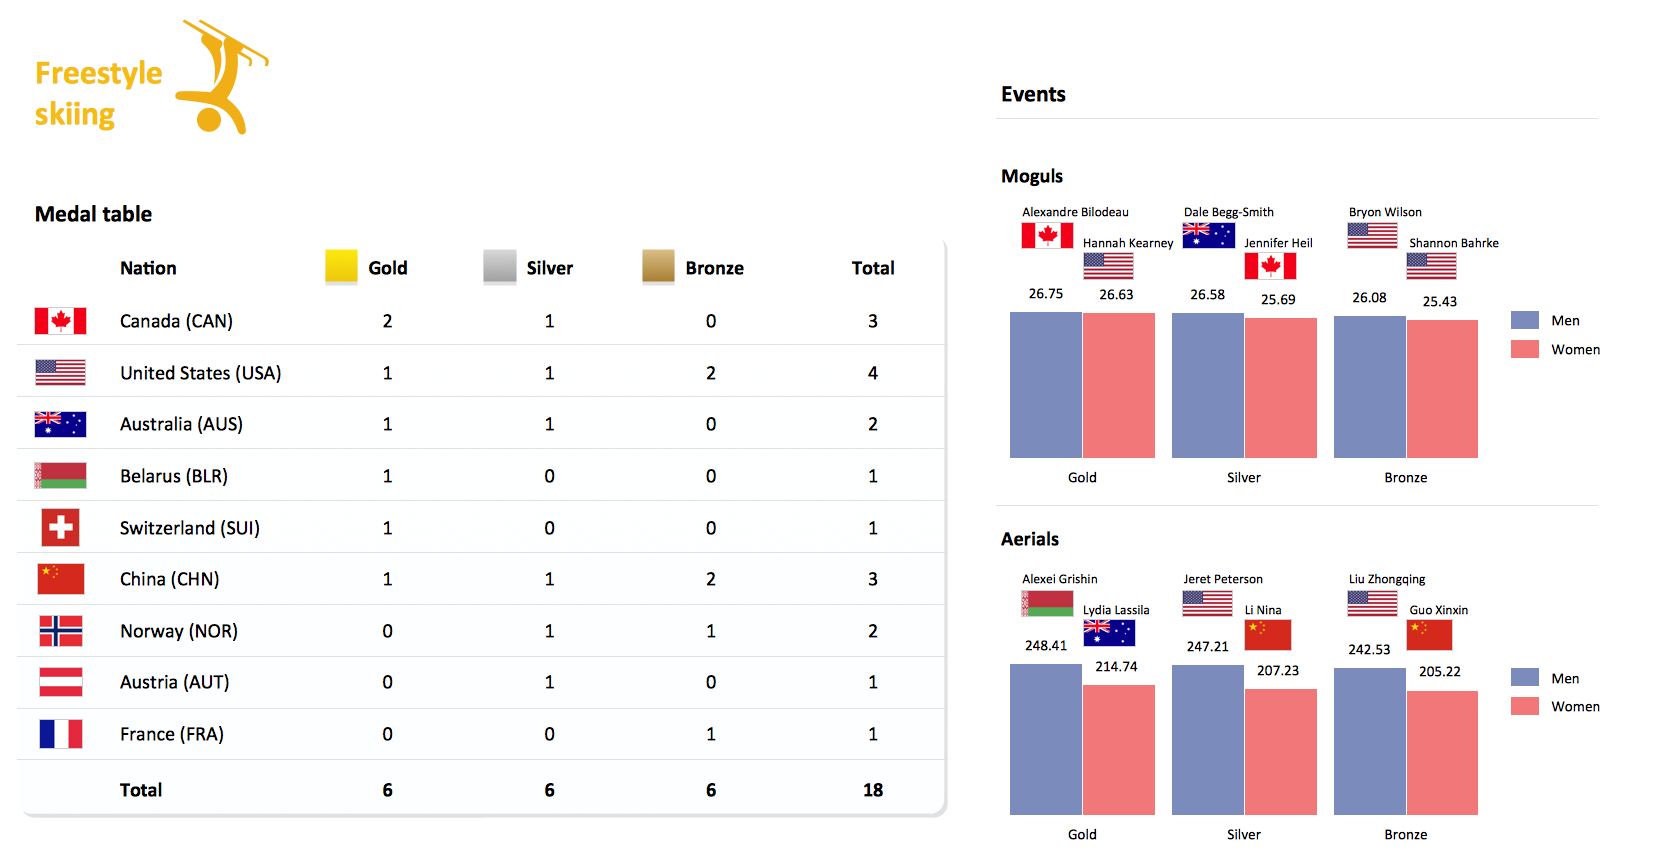
Visualizing data in infographics format is a modern way to represent any statistics related to global sporting events, such as Winter Olympic Games. ConceptDraw DIAGRAM software extended with the Winter Sports solution delivers a rich set of samples and templates helps you produce all kind of sporting information, such as tournament schedule or medal table.Winter Sports. Olympic Games Illustrations. Medal Summary
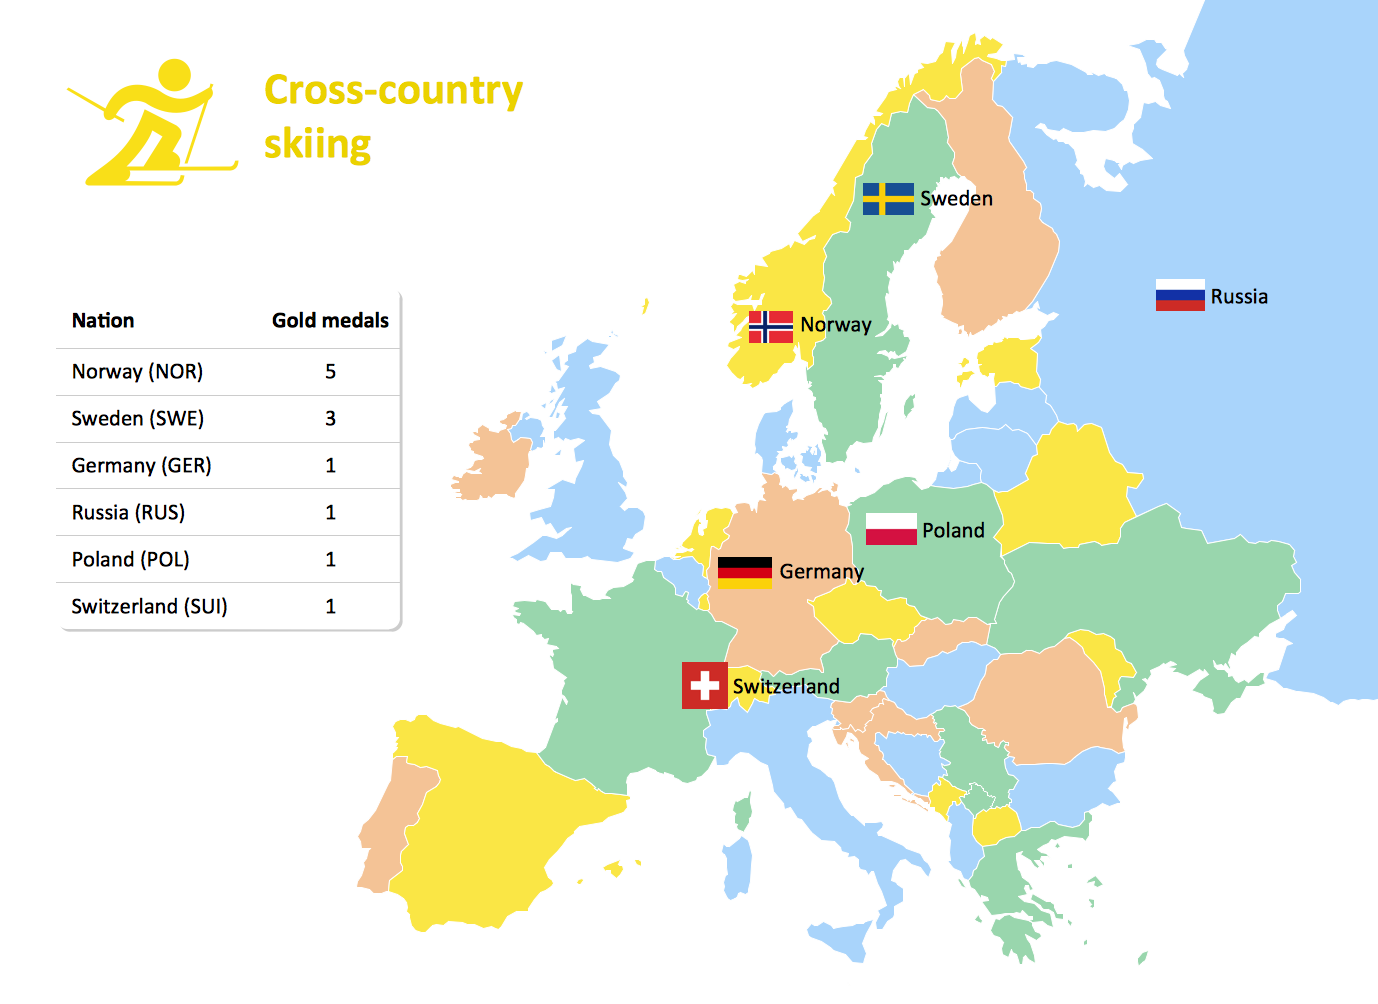
Do you like infographics and data visualization? Creating infographics is super-easy with ConceptDraw.Winter Sports Vector Clipart. Medal Map. Spatial Infographics
Tracking Olympic results in visual format is the most modern way to deliver statistics to a broad audience. This is a good example of an illustrated table you may easily modify, print, or publish on web from ConceptDraw Winter Sports solution.Sport pictograms. Olympic Games
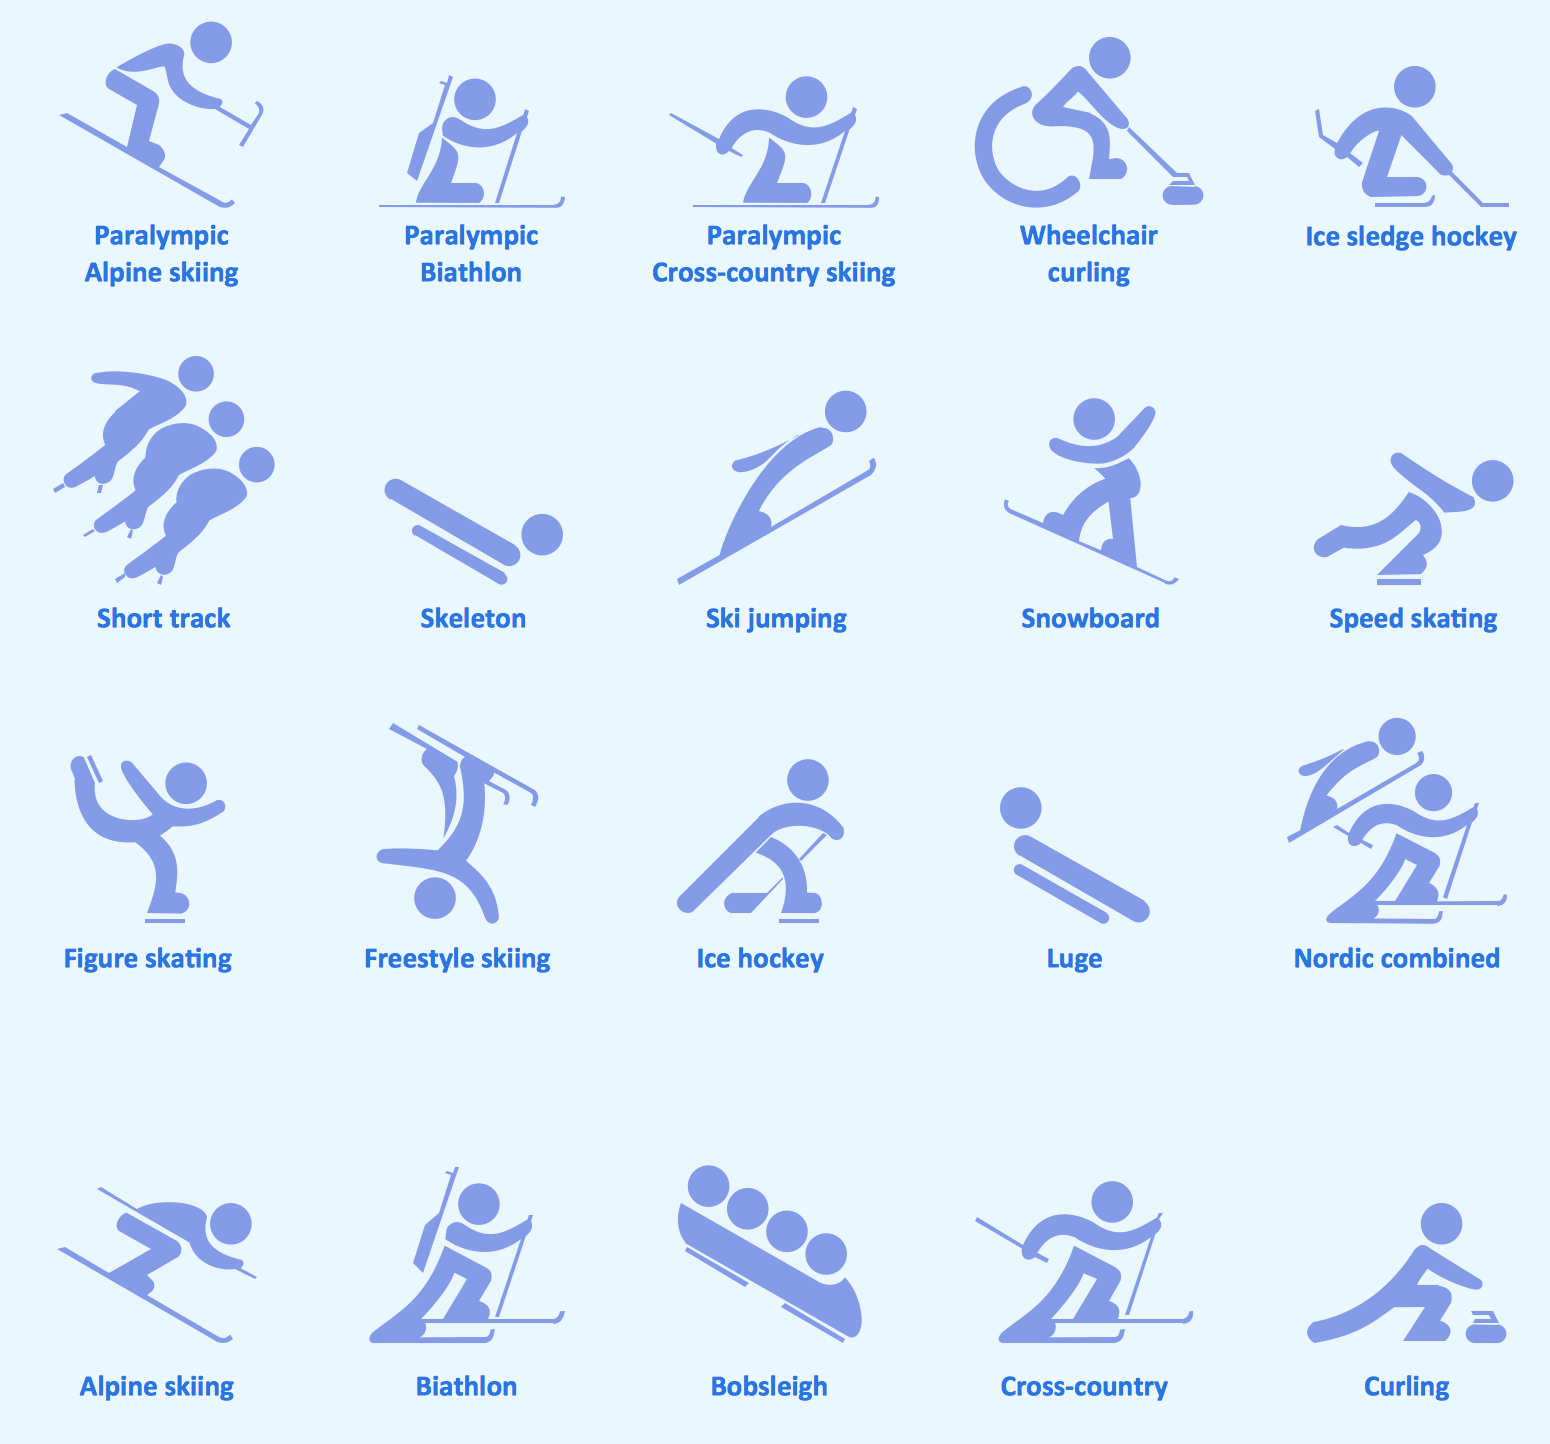
The Winter Sports solution from Sport Area of ConceptDraw Solution Park contains winter sports pictograms you may use illustrating any kind of material about Olympic Games or any other sport competitions.Winter Sports. Illustrations and Visualize Statistics
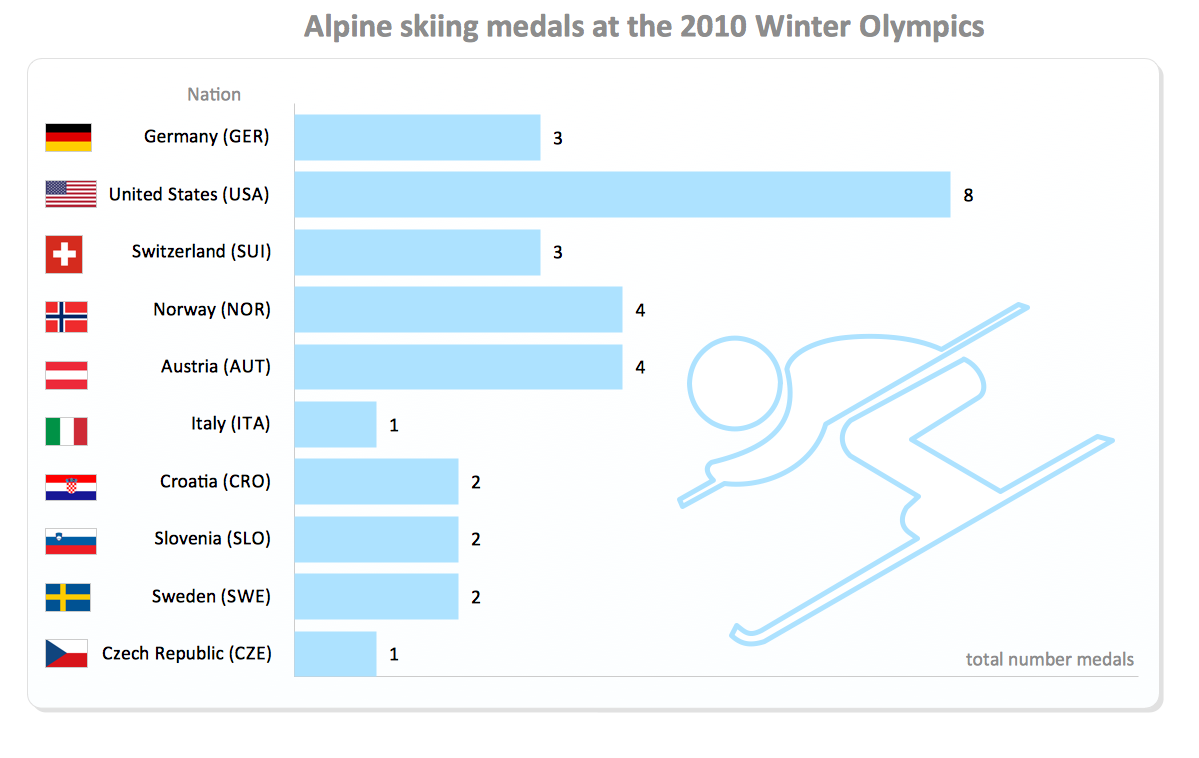
Visualizing sports statistics becomes as easy as never before with ConceptDraw DIAGRAM software extended with the Winter Sports solution. This solution delivers a complete set of winter sports illustrations, samples and templates you may use to visualize any kind of sports statistics in minutes.Spatial infographics Design Elements: Transport Map
Do you like infographics and data visualization? Creating infographics is super-easy with ConceptDraw.Winter Sports. Using Winter Sports Design Elements Producing Infographics
The Winter Sports solution from Sport Area of ConceptDraw Solution Park contains winter sports pictogram you may use illustrating any kind of material about Olympic Games or any other sport competitions.Design Pictorial Infographics. Design Infographics
In the course of recent decades data visualization went through significant development and has become an indispensable tool of journalism, business intelligence and science. The way visual information may be conveyed is not limited simply to static or dynamic representation, it can also be interactive. Infographics can be conditionally divided into several general levels. Primarily, this is level of visualization of information, its interpretation and association on any ground. Second level can be defined as a visualization of knowledge, depiction of thoughts and ideas in the form of images or diagrams. Finally, the level of data visualization, which processes data arrays in charts, enabling the information to be more clearly perceived. You can also identify the main approaches to the creation of infographics: exploratory and narrative. Exploratory method insists on minimalist design in favor of data precision without unnecessary details and is common for scientific researches and anaBasketball Illustrations
It’s very important that your basketball illustrations looked bright, beautiful, interesting and attracted the attention. For this you just need to add the illustrations! The Basketball solution delivers two libraries with predesigned vector clipart objects. Simply drag the needed clipart to your diagram to make it successful.Flowchart
The Flowcharts are widespread in various fields and include the multitude of types. They are dedicated to representation the algorithms, processes, workflows of any complexity in a clear and intuitive format. The Flowcharts are commonly used in software development as a visual tool for illustration algorithms and logic of computer programs, in business for illustration business scenarios, in education, and so on. For drawing the Flowchart are used the special object blocks, among them rectangle or box used to represent an activity or step, rounded box or oval to depict Start / End, diamond to represent the decision point (involves the branching yes/no), circle used to represent the point of connection, parallelogram to represent the Input / Output, and some others. With ConceptDraw DIAGRAM including Flowcharts solution it is easy to create professional-looking Flowchart diagrams of any complexity and any degree of detailing. Succeed in drawing the Flowcharts using quick-start templates, predesigned samples and extensive libraries of ready-made flowchart symbols, blocks and icons.Basketball Field in the Vector
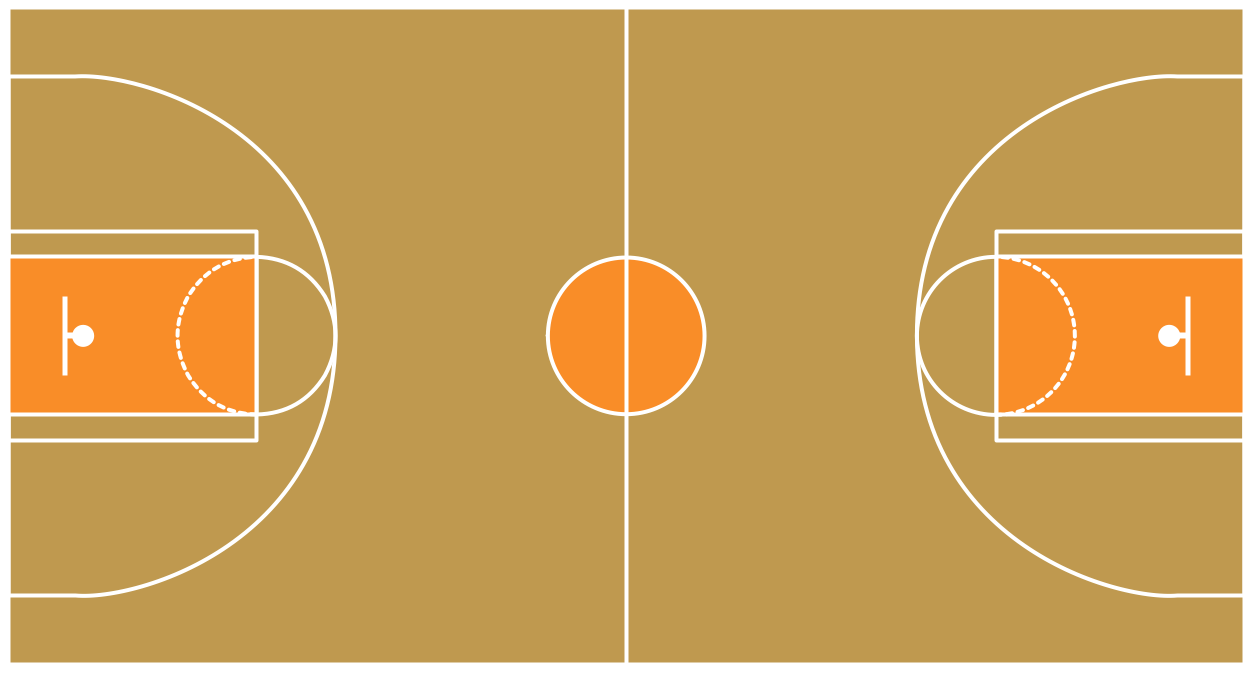
The Basketball Field library from the Basketball solution provides a complete set of ready-to-use predesigned vector courts: horizontally and vertically located, whole and half of court, colored and not, courts with views from different sides. All courts objects are designed according to the real basketball courts dimensions. Simply drop the needed basketball field in the vector from the library to design your own basketball diagram.
 Winter Sports
The Winter Sports solution from Sport area of ConceptDraw Solution Park contains winter sports illustration examples, templates and vector clipart libraries.
- Winter Sports | Winter Sports . Olympic Games Illustrations. Medal ...
- Sport pictograms. Olympic Games | Pictures Of The Skeleton Sport
- Winter Sports | Winter Sports . Olympic Games Infographics. Medal ...
- Sport Pictures
- Winter Sports . Olympic Games Illustrations. Medal Summary | Winter ...
- Diagram With Pictures Of All The Winter Olympic Events
- Picture Of The Bobsleigh Symbol Olympics
- Picture Graph | Line Graph | Infographic Maker | Population Control ...
- Sport pictograms. Olympic Games | Winter Sports . Illustrations and ...
- Winter Sports | Sport Field Plans | ConceptDraw Solution Park | Bar ...
- Soccer ( Football ) Field Templates | Winter Sports . Olympic Games ...
- Winter Sports | Winter Sports Vector Clipart. Medal Map. Spatial ...
- Winter Sports . Olympic Games Infographics. Medal Table | Winter ...
- Winter Sports . Olympic Games Infographics. Medal Table | Winter ...
- Sport pictograms. Olympic Games | Design elements - Winter ...
- Winter Sports . Illustrations and Visualize Statistics | Sport pictograms ...
- Winter Sports . Illustrations and Visualize Statistics | Winter Sports ...
- Winter Sports . Olympic Games Infographics. Medal Table | Basic ...
- Sport pictograms. Olympic Games | Winter Sports . Using Winter ...
- Winter Olympics pictograms - Vector stencils library | Winter Sports ...
