Project Timeline
Project timeline is a type of chart which allows visually represent the chronology of works for the project, placing the key points of the project (milestones) on a timescale. You need to make professional looking project timeline? Create it with ConceptDraw PRO! ConceptDraw PRO extended with Timeline Diagrams Solution from the Management Area is the best timeline diagrams softwareTimeline Diagrams
Timeline is a powerful tool for project management and project scheduling, it is a convenient way to represent a chronological sequence of events and critical milestones along a time axis. Timeline allows quickly understand the temporal relationships and to see the progress of a project schedule. ConceptDraw PRO extended with Timeline Diagrams solution from the Management area of ConceptDraw Solution Park is a powerful software for fast and easy drawing useful and great-looking timeline diagrams.How to Make a Timeline
Timeline is a type of diagram which illustrates the series of events in a chronological order on a linear timescale. How to make a timeline? It is convenient to use a modern powerful software. ConceptDraw PRO diagramming and vector drawing software extended with Timeline Diagrams solution from the Management area is exactly what you need.Stakeholder Onion Diagram Template
For depicting the onion model are actively used Stakeholder Onion Diagrams. The ConceptDraw PRO diagramming and vector drawing software extended with Stakeholder Onion Diagrams Solution from the Management Area of ConceptDraw Solution Park offers the number of useful tools and Stakeholder Onion Diagram template for their easy design.Timeline Examples
ConceptDraw PRO diagramming and vector drawing software offers the Timeline Diagrams solution from the Management area which is rich for the timeline examples, samples, templates and ready-to-use vector shapes.How To use House Plan Software
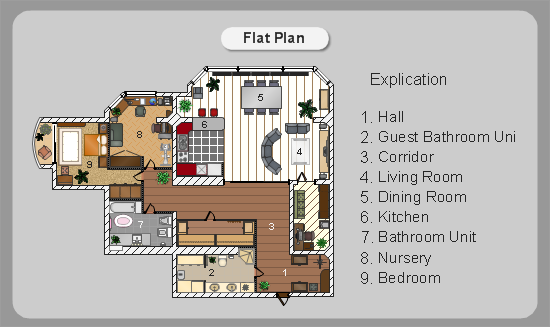
House Plan Software — Create house blueprints or a construction drawing. This example is created using ConceptDraw PRO diagramming software enhanced with solution Building Plans from ConceptDraw Solution Park.
How To create Value Stream Map (VSM)
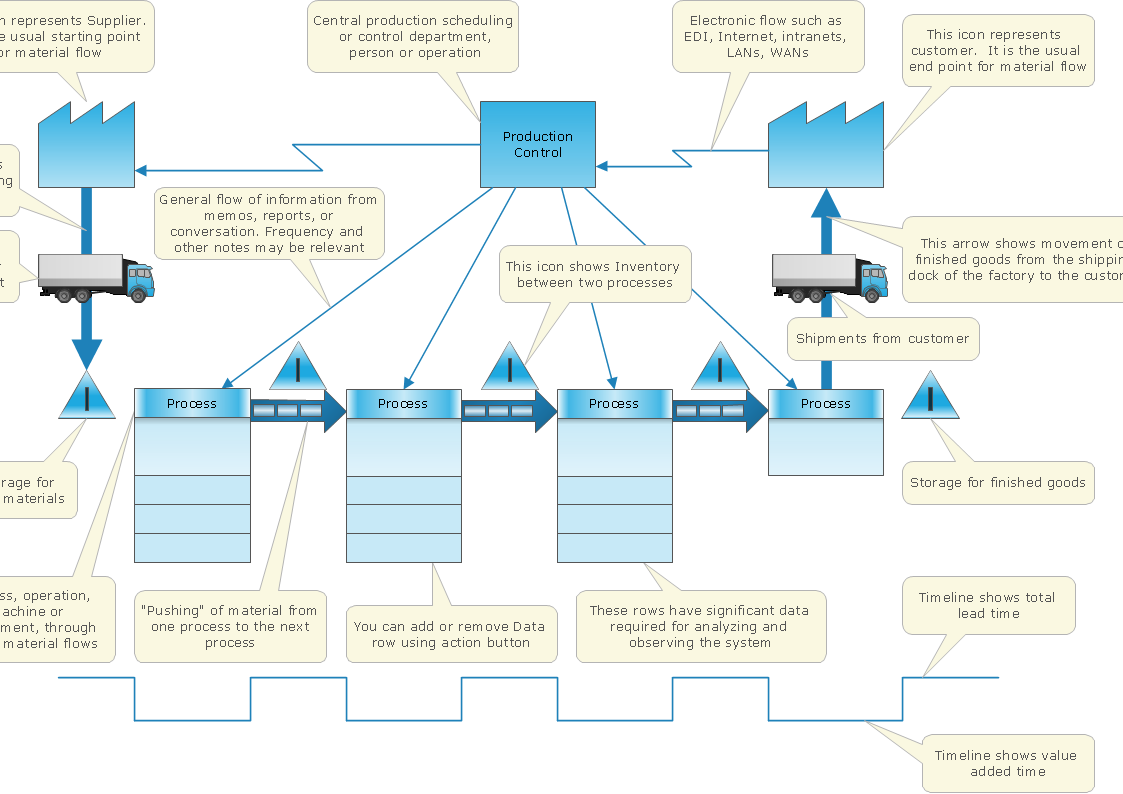
Value Stream Map template helps you to create VSM diagrams using ConceptDraw PRO software.3 Circle Venn Diagram. Venn Diagram Example
This template shows the Venn Diagram. It was created in ConceptDraw PRO diagramming and vector drawing software using the ready-to-use objects from the Venn Diagrams Solution from the "What is a Diagram" area of ConceptDraw Solution Park. Venn Diagrams visualize all possible logical intersections between several sets and are widely used in mathematics, logic, statistics, marketing, sociology, etc.Activity Network Diagram Method
Activity Network Diagram - This sample was created in ConceptDraw PRO diagramming and vector drawing software using the Seven Management and Planning Tools solution from the Management area of ConceptDraw Solution Park. This sample shows the PERT (Program Evaluation Review Technique) chart of the request on proposal. A request for proposal (RFP) is a request of the company or the organization to potential suppliers to submit the business proposals for service or goods that it is interested to purchase. The RFP is represented on the initial procurement stage and allows to define the risks and benefits.Competitor Analysis
Competitor analysis is a first and obligatory step in elaboration the proper corporate marketing strategy and creating sustainable competitive advantage. Use powerful opportunities of numerous solutions from ConceptDraw Solution Park for designing illustrative diagrams, charts, matrices which are necessary for effective competitor analysis.
 Picture Graphs
Typically, a Picture Graph has very broad usage. They many times used successfully in marketing, management, and manufacturing. The Picture Graphs Solution extends the capabilities of ConceptDraw PRO v10 with templates, samples, and a library of professionally developed vector stencils for designing Picture Graphs.
Business Process Modeling Notation Template
Create business process diagrams (BPMN 2.0.) with ConceptDraw using professional looking templates and business process improvement tools.Business Process Mapping — How to Map a Work Process
ConceptDraw PRO is a world-class diagramming platform that lets you display, communicate, and present dynamically. It′s powerful enough to draw everything from basic flowcharts to complex engineering schematics. Video tutorials on ConceptDraw products. Try it today!Matrix Organization Structure
Matrix organizational structure is one of the main forms of structures which is actively used by organizations to carry forth the functions of a company visually and effectively. Now we have ConceptDraw PRO diagramming and vector drawing software extended with 25 Typical Orgcharts solution from the Management area of ConceptDraw Solution Park which will help easy represent matrix organizational structure of any degree of complexity.Seating Chart Template
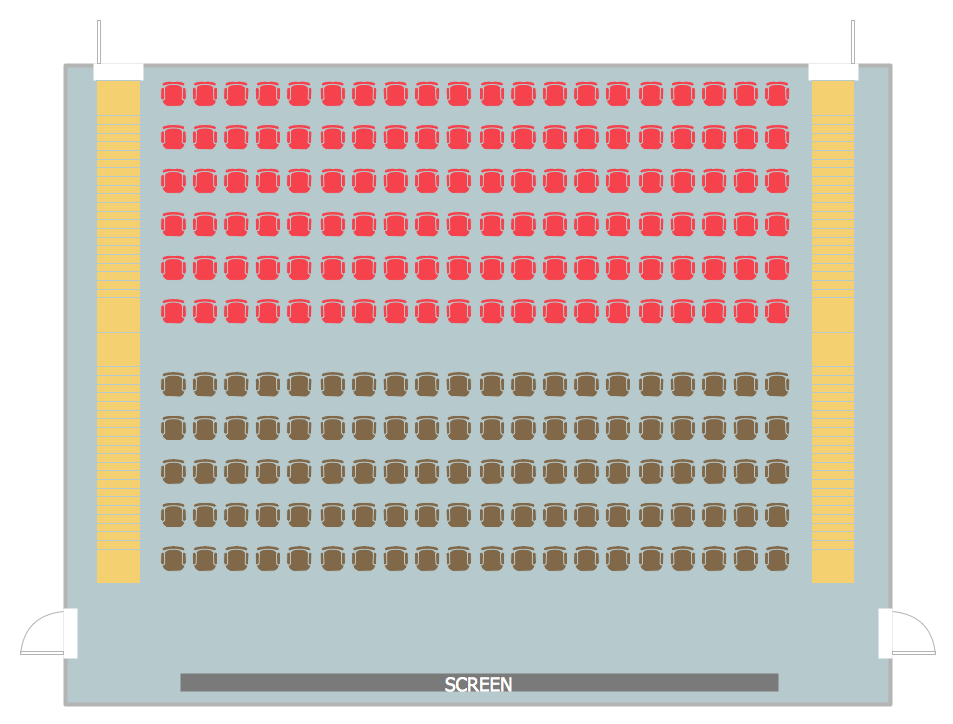
Seating chart developing is necessity for constructing and building the cinemas, theaters, banquet halls, auditoriums, and other premises for accommodation a large number of people. Seating chart template can help you design professional looking seating plan. ConceptDraw PRO diagramming and vector drawing software recommends you to use the Seating Plans solution from the Building Plans area for designing the seating charts.- Process Flowchart | Stakeholder Onion Diagram Template ...
- Easy Timeline Template
- Bar chart - Template | Bar Chart Template for Word | Timeline ...
- Drawio Timeline Template
- Cleaning Recruitment Process Flow Chart Template
- How to Make a Timeline | Project Timeline | Competitor Analysis ...
- Professional Timeline Template
- Tax Picture Vector
- Office Timeline 2010 Free Download
- Line graph - Template | Bar chart - Template | Process Flowchart ...
- Step Area Graph | US incarceration timeline -clean - Area graph ...
- How to Make a Timeline | Federal timeline US prisoners - Area chart ...
- Picture Graphs | Seating Plans | Plumbing and Piping Plans ...
- Swimlane Timeline Template
- US incarceration timeline -clean - Area graph | US incarceration ...
- Area chart - Template | Design elements - Area charts | Line Chart ...
- Visio Fishbone Diagram Template
- Pictures of Graphs | Regional population growth from 2010 to 2016 ...
- CCTV Network Example | CCTV Network Diagram Software | CCTV ...


