Pie Chart Examples and Templates
A pie chart or a circle graph is a circular chart divided into sectors, illustrating numerical proportion. In a pie chart, the arc length of each sector and consequently its central angle and area, is proportional to the quantity it represents. Pie chart examples and templates created using ConceptDraw PRO software helps you get closer with pie charts and find pie chart examples suite your needs.Sales Growth. Bar Graphs Example
This sample was created in ConceptDraw PRO diagramming and vector drawing software using the Bar Graphs Solution from Graphs and Charts area of ConceptDraw Solution Park. It is Bar Graphs example, Sales Growth example, Column Chart Example - Sales Report.Sample Pictorial Chart. Sample Infographics
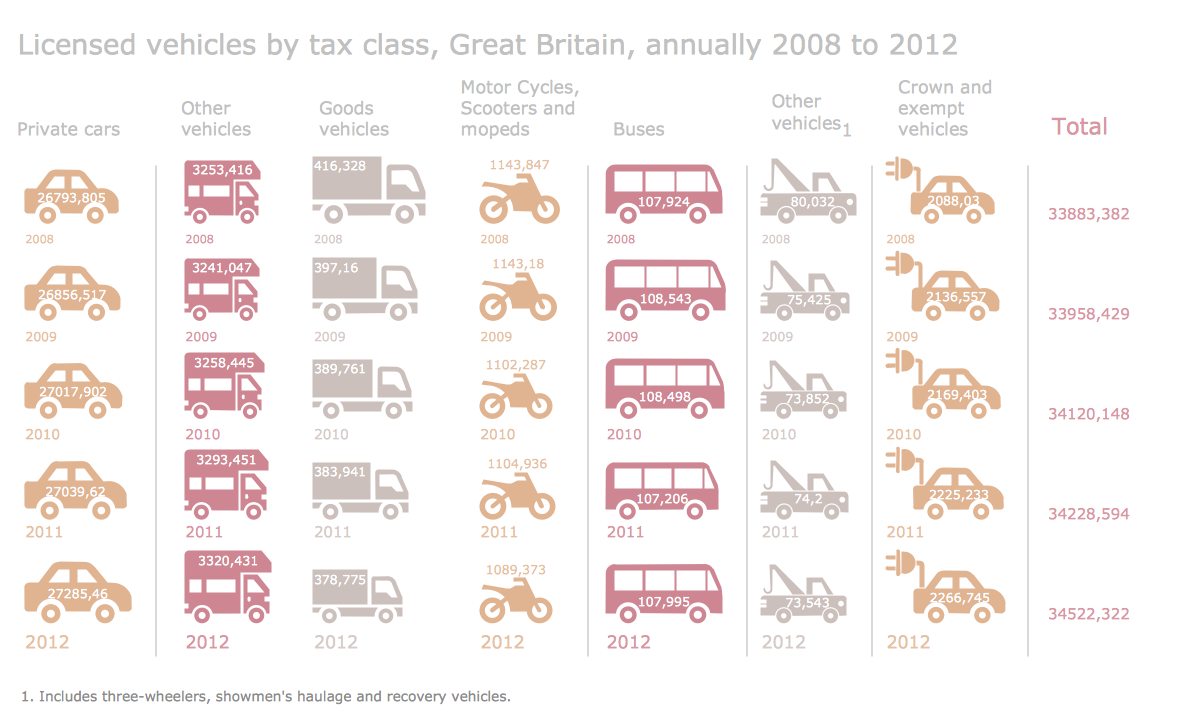
Sample Pictorial Chart - Pictorial Infographics solution provides easy-to-use design infographics drawing tools, large collection of different sample infographics and infograms, sample pictorial chart and templates to be filled in, and 10 libraries with great quantity of predesigned vector pictograms. Use Pictorial Infographics solution to draw your own design pictorial infographics documents quick and easy.Competitor Analysis
Competitor analysis is a first and obligatory step in elaboration the proper corporate marketing strategy and creating sustainable competitive advantage. Use powerful opportunities of numerous solutions from ConceptDraw Solution Park for designing illustrative diagrams, charts, matrices which are necessary for effective competitor analysis.Scatter Chart Examples
The Line Graphs solution from Graphs and Charts area of ConceptDraw Solution Park contains a set of examples, templates and design elements library of scatter charts. Use it to draw scatter graphs using ConceptDraw PRO diagramming and vector drawing software for illustrating your documents, presentations and websites.Information Graphics
Creating of professional looking Information Graphics was always been a complex process. But now it's easier than ever thanks to the ConceptDraw PRO diagramming and vector drawing software extended with Pictorial Infographics Solution from the “What are Infographics” Area.Simple Diagramming
Create flowcharts, org charts, floor plans, business diagrams and more with ConceptDraw PRO.
Flow Chart Diagram Examples
Draw your own business process flowcharts using ConceptDraw PRO diagramming and business graphics software.UML Diagram for Mac
This sample was created on the Mac in ConceptDraw PRO diagramming and vector drawing software using the UML State Machine Diagram library of the Rapid UML Solution from the Software Development area of ConceptDraw Solution Park.How to Simplify Flow Charting — Cross-functional Flowchart
In ConceptDraw PRO it really is sp simple to draw even the most complex cross-functional flowcharts. Use the RapidDraw technology and Cross-Functional libraries in ConceptDraw PRO for the best results.HelpDesk
How to Create Education Infographics
Education Infographics is used to display a lot of education-related information in a single, visually-appealing graphic. Infographics, created for education purposes can contain different illustrations, detailed charts, and data. ConceptDraw PRO can be used as a tool for creating education infographics. It allows you to draw infographics quickly and easily using the special templates and vector stencils libraries. Infographics can be used to quickly communicate a message, to simplify the presentation of large amounts of data, to see data patterns and relationships, and to monitor changes in variables over time. It can contain bar graphs, pie charts, histograms, line charts, e.t.c.Social Media Flowchart Symbols
Social media is a popular view of mass communication which allows people, companies and organizations create, share, discover, modify, access, comment, discuss and exchange information through the Internet. Social Media Response solution for ConceptDraw PRO provides collection of 10 libraries with diversity of predesigned vector social media flowchart symbols for fast and easy creating interactive Social Media Flowcharts, Response Charts and Action Mind Maps.Visual Presentations Made Easy with Diagramming Software
Automatically create a presentation-quality diagram in one click with ConceptDraw PRO.
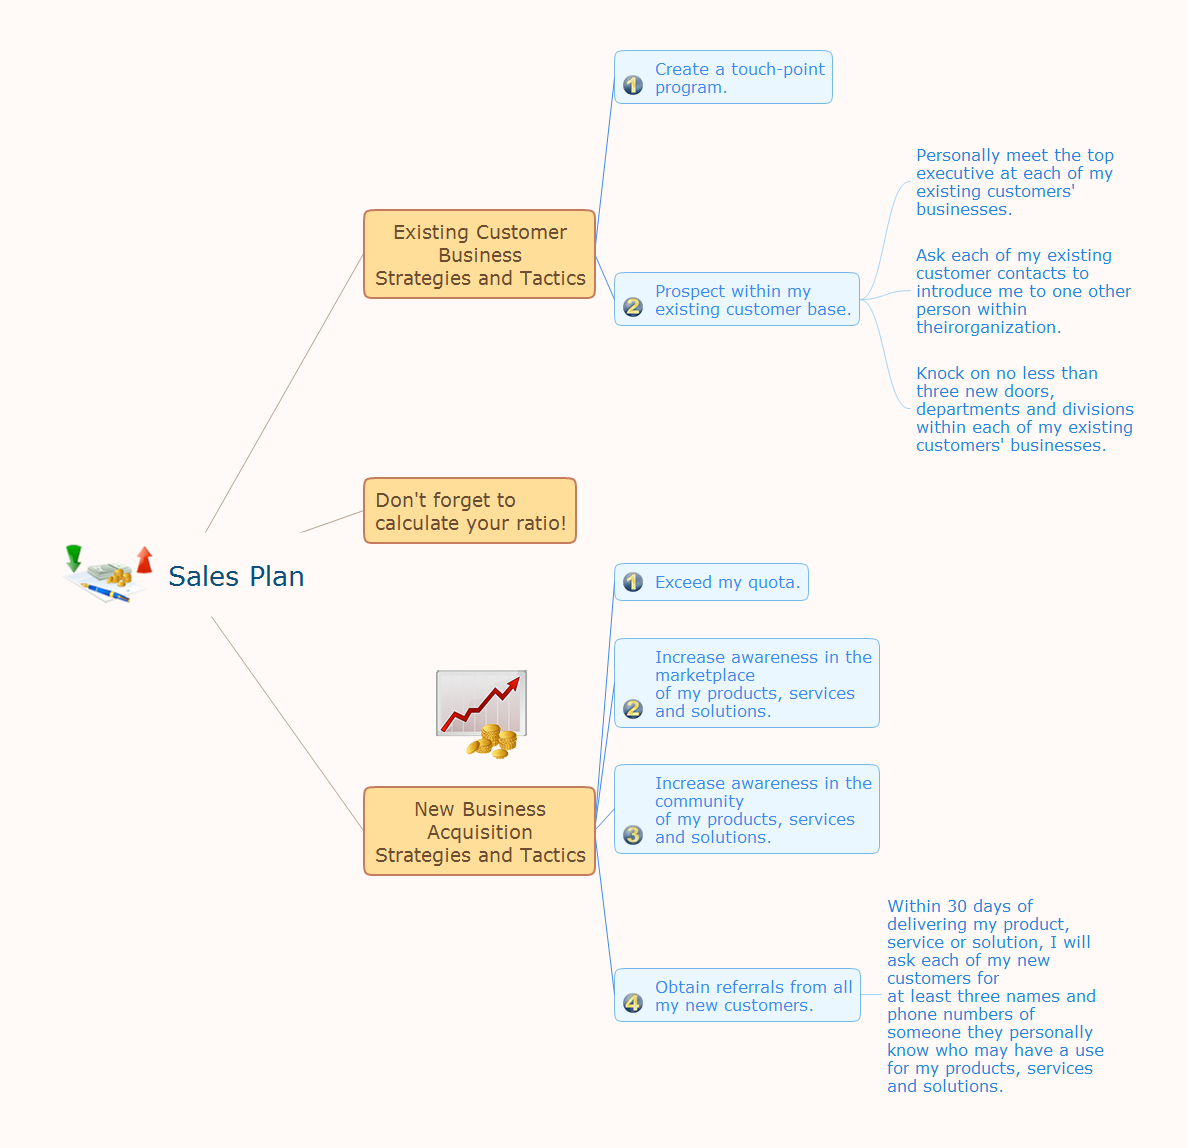
How to Deliver Presentations using Mind Maps
Creating and organizing presentations, structuring received presentations, presenting mind maps, and preparing for public presenting.- Percentage Pie Chart . Pie Chart Examples | Atmosphere air ...
- Percentage Pie Chart . Pie Chart Examples | Sector diagram ...
- Basic Diagramming | Pie Chart Word Template. Pie Chart Examples ...
- Atmosphere air composition | Pie Chart Examples and Templates ...
- Draw A Pie Chart Of Different Gases Present On Earth
- Pie Chart Examples and Templates | How to Create a Pie Chart | Pie ...
- Pie Charts | How to Draw a Pie Chart Using ConceptDraw PRO ...
- Draw A Pie Chart Showing Different Gases And Their Percentage In
- Percentage Pie Chart . Pie Chart Examples | Atmosphere air ...
- Percentage Pie Chart . Pie Chart Examples
- Sales Growth. Bar Graphs Example | Line Chart Examples ...
- Atmosphere air composition | Percentage Pie Chart . Pie Chart ...
- Data -driven charts - Vector stencils library | How to Add Data -driven ...
- How to Draw the Different Types of Pie Charts | Online Diagram Tool ...
- Histogram Pie Chart
- Schedule pie chart - Daily action plan | How to Draw a Pie Chart ...
- How to Draw the Different Types of Pie Charts | How to Draw a Pie ...
- Pie Charts | Logistics Flow Charts | Bar Diagram Math | Natural ...
- Donut Chart Templates | Pai Chart Of Persentage Of Gases Present ...
- Pie Chart Word Template. Pie Chart Examples | How to Make SWOT ...


