Pie Chart
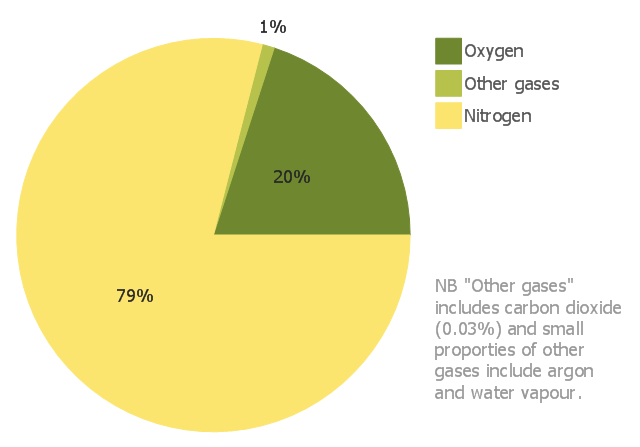
ConceptDraw DIAGRAM diagramming and vector drawing software offers the Pie Charts solution from the Graphs and Charts area of ConceptDraw Solution Park for quick and easy drawing the Pie Chart of any complexity.This pie chart sample shows the approximate composition of the air.
"The atmosphere of Earth is a layer of gases surrounding the planet Earth that is retained by Earth's gravity. The atmosphere protects life on Earth by absorbing ultraviolet solar radiation, warming the surface through heat retention (greenhouse effect), and reducing temperature extremes between day and night (the diurnal temperature variation).
The common name given to the atmospheric gases used in breathing and photosynthesis is air. By volume, dry air contains 78.09% nitrogen, 20.95% oxygen, 0.93% argon, 0.039% carbon dioxide, and small amounts of other gases. Air also contains a variable amount of water vapor, on average around 1%. Although air content and atmospheric pressure vary at different layers, air suitable for the survival of terrestrial plants and terrestrial animals currently is only known to be found in Earth's troposphere and artificial atmospheres." [Atmosphere of Earth. Wikipedia]
This pie chart sample was redesigned from the Wikimedia Commons file: Air composition pie chart.JPG.
[commons.wikimedia.org/ wiki/ File:Air_ composition_ pie_ chart.JPG]
This file is licensed under the Creative Commons Attribution-Share Alike 3.0 Unported license. [creativecommons.org/ licenses/ by-sa/ 3.0/ deed.en]
The pie chart example "Approximate composition of the air" was created using the ConceptDraw PRO diagramming and vector drawing software extended with the Basic Pie Charts solution of the Graphs and Charts area in ConceptDraw Solution Park.
Online Flow Chart
ConceptDraw DIAGRAM diagramming and vector drawing software extended with tools of Flowcharts Solution from the "Diagrams" Area of ConceptDraw Solution Park ideally suits for fast and easy Online Flow Chart designing. We propose to verify this right now.
 Education Package
Education Package is a comprehensive set of multifarious graphical solutions from ConceptDraw Solution Park, collected together in help to ConceptDraw DIAGRAM users working in a field of science, education and training, which is aimed at improving the quality of education and helping to design with ease variety of interesting and colorful educational materials, diagrams, charts and maps. Use it to present the information and knowledge in an interesting, clear, structured and simple form to achieve a success in education and pedagogy, to maintain the interest of students and pupils throughout the whole learning process, at the lectures, lessons and even during independent work with additional materials, to contribute to better perception of scientific information by listeners during the conferences and reports.
Multi Layer Venn DiagramVenn Diagram Example
To visualize the relationships between subsets of the universal set you can use Venn diagrams. To construct one, you should divide the plane into a number of cells using n figures. Each figure in the chart represents a single set of, and n is the number of represented sets. Splitting is done in a way that there is one and only one cell for any set of these figures, the points of which belong to all the figures from the set and do not belong to others. The plane on which the figures are represented, is the universal set U. Thus, the point which does not belong to any of the figures, belongs only to U.
Table Seating Chart Template
The arrangement of tables and seating charts near them have great value in many premises and situations. It is often very convenient to draw a plan before the furniture arrangement. ConceptDraw DIAGRAM software offers the Seating Plans solution from the Building Plans area for fast and easy drawing the table seating chart template and samples.
 Business Management Package
Business Management Package is a large set of graphical solutions from the ConceptDraw Solution Park. They are selected to help in solving the business, management, marketing and quality tasks in a best way. It is useful for many management specialists, marketing experts, business specialists, international business experts, IT managers, specialists in managing the business processes, financial specialists, and other business related specialists. Create documents, reports, statistical summaries, describe business processes, build business models for many fields including finance, education, logistic, landscape design, health, cooking, and many more.
 Rapid UML
In order to create any of the described drawings, the ConceptDraw DIAGRAM vector diagramming and drawing software can be used. Having the Rapid UML solution that extends the ConceptDraw DIAGRAM application with the ability to develop the needed UML diagrams within a short period of time, can help you complete the UML-related tasks faster. This solution uses the so-called “ConceptDraw RapidDraw” techniques and it may be useful for many different IT specialists, programmers, software developers, software engineers.
Sales Process Management
Sales process management is a business discipline which focuses on the development and practical application of various sales techniques, and on the management of sales operations of the company.It is effective to use professional software for the sales process management. ConceptDraw DIAGRAM diagramming and vector drawing software extended with Sales Flowcharts solution from the Marketing area of ConceptDraw Solution Park is the best choice.
Food and Beverage
Restaurant business is one of the most popular and actively developing business in the world. Advertising and marketing are an integral part of its development. Use the ConceptDraw DIAGRAM software extended with Food Court solution from the Food and Beverage area of ConceptDraw Solution Park for easy drawing professional looking, colorful and attractive food and beverage illustrations!Pie Graph Worksheets
Pie Graph is very popular kind of charts which is widely used in various fields of science and life activities. ConceptDraw DIAGRAM extended with Pie Charts Solution from the Graphs and Charts area is the best software for drawing the Pie Graph Worksheets.
 Basic Circle-Spoke Diagrams
Basic Circle-Spoke Diagrams solution makes ConceptDraw DIAGRAM the best software for creating the Circle-Spoke Diagrams, Circle Diagrams, and Spoke Diagrams. It offers the library of vector stencils, the set of illustrative samples and gives the introduction about what is a circle spoke diagram or what is a spoke diagram. Use any of included samples as a circle spoke diagram template to design a professionally-looking Circle Spoke Diagram of any complexity literally in a few moments and use it in business documentation, report or simply share with colleagues.
 Summer Sports
ConceptDraw DIAGRAM, complemented by the highly functional Summer Sports solution, is an effective way to create summer sports infographics, illustrations, and diagrams. This solution contains a huge collection of pre-designed vector objects for sports clipart of various types and directions, and various sports icons — cycling vector sport icon, gymnastics vector icons, water sport vector icons, equestrian vector icons, extreme sports vector icons, and many others. Many pictorial summer sports samples are also included. Use the Summer Sports solution tools to develop visual materials for presentations and conferences, summer sports posters, illustrations for travel programs, clothing and item designs with sports icons, and promotional materials to attract visitors to sports and other sport events.
Bar Diagrams for Problem Solving. Create space science bar charts with Bar Graphs Solution
Bar charts represent data in different categories or groups. Create bar graphs for visual solving your scientific problems and data comparison using the ConceptDraw DIAGRAM diagramming and vector drawing software extended with the Bar Graphs Solution from the Graphs and Charts area of ConceptDraw Solition Park.
 USA Maps
The USA Maps solution can be used as an additional tool to the ConceptDraw DIAGRAM diagramming and drawing software. Each of the pre-made maps that are available to be taken from this solution is scaled. The USA Maps solution allows using the option of adding further details such as country’s borders, states’ names, their capitals and major cities that can be either shown or hidden by using the action menu for each of the state maps. The solution is incredibly useful for all who have an international business working with people, providing other countries products from the USA, or making purchases to supply those who live in the US with.
 Environmental, Social, and Corporate Governance
The Environmental, Social, and Corporate Governance solution with diversity of drawing tools, libraries of pre-made vector elements, and thematic samples is the best to illustrate the key points of ESG, specify ESG criteria and ESG risks. This helps investors evaluate potential investments and avoid investment losses. Outline ESG factors and ESG standards to protect the environment, avoid climate change and biodiversity loss, illustrate principles of sustainability, waste management, supply chain management, and the importance of the use of renewable energy and renewable resources. Depict easily the policies of the companies that adhere to ESG standards.
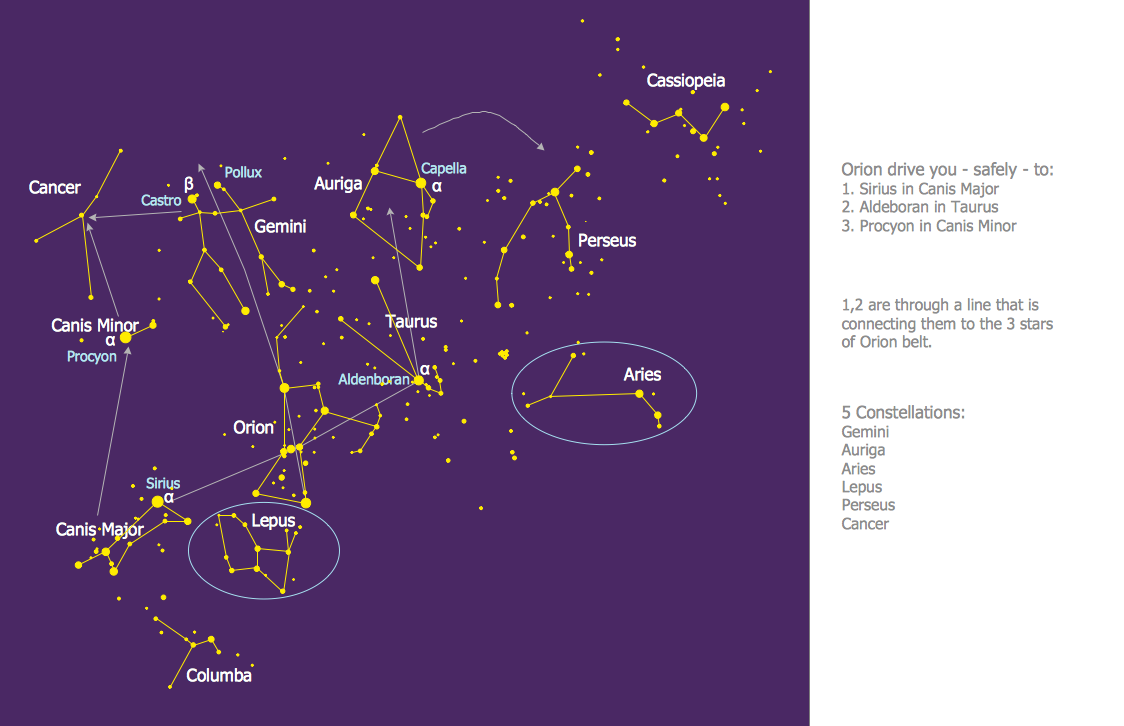
Constellation Chart
ConceptDraw DIAGRAM diagramming and vector drawing software provides the Astronomy solution from the Science and Education area. This solution offers you all needed tools for drawing the constellation chart of any complexity without difficulties. Astronomy solution contains 4 libraries with vector objects of all variety of constellations: Constellations Except Zodiac Northern and Southern, Northern Constellations, Southern Constellations and Zodiac Constellations.Pie Chart Word Template. Pie Chart Examples
The Pie Chart visualizes the data as the proportional parts of a whole and looks like a disk divided into sectors. The pie chart is type of graph, pie chart looks as circle devided into sectors. Pie Charts are widely used in the business, statistics, analytics, mass media. It’s very effective way of displaying relative sizes of parts, the proportion of the whole thing.- Atmosphere air composition | Percentage Pie Chart . Pie Chart ...
- Pie Chart Examples and Templates | Pia Diagram Of The ...
- Atmosphere air composition | Design elements - Composition charts ...
- Atmosphere air composition | Design elements | Pie Chart
- Atmosphere air composition | Pie Chart Of Water Available In Earth
- Atmosphere air composition | Pie Chart Of Gases Found In Air
- Target and Circular Diagrams | Images Of Pie Chart About The ...
- Atmosphere air composition | Pie Chart Of Components Of Air Com
- Approximate composition of the air - Pie chart | Approximate ...
- Design elements - Stars and planets | Pro Planet Wikipedia


