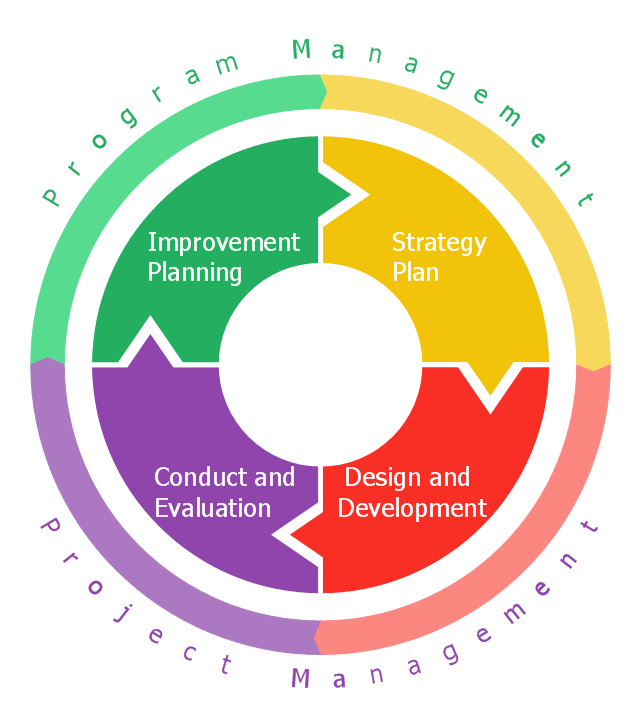
This circular arrows diagram sample shows the exercise cycle stages: 1) Strategy plan, 2) Design and development, 3) Conduct and evaluation, 4) Improvement planning. It was designed on the base of the diagram on the Emergency Management Insitute training IS-120.b webpage from the website of the Federal Emergency Management Agency (FEMA) of the United States Department of Homeland Security.
[emilms.fema.gov/ IS120A/ summary.htm]
"Exercises give communities, states, and regions a set of essential tools to prevent, prepare for, respond to, and recover from disasters." [emilms.fema.gov/ IS120A/ module0.htm]
"Disaster management (or emergency management) is the creation of plans through which communities reduce vulnerability to hazards and cope with disasters. Disaster management does not avert or eliminate the threats; instead, it focuses on creating plans to decrease the effect of disasters. Failure to create a plan could lead to human mortality, lost revenue, and damage to assets. Currently in the United States 60 percent of businesses do not have emergency management plans. Events covered by disaster management include acts of terrorism, industrial sabotage, fire, natural disasters (such as earthquakes, hurricanes, etc.), public disorder, industrial accidents, and communication failures." [Emergency management. Wikipedia]
The diagram example "Emergency management exercise cycle" was created using the ConceptDraw PRO diagramming and vector drawing software extended with the Circular Arrows Diagrams solution from the area "What is a Diagram" of ConceptDraw Solution Park.
Tools to Create Your Own Infographics
Over the past few centuries, data visualization has evolved so much that we use it every day in all areas of our lives. Many believe that infographic is an effective tool of storytelling, as well as analytics, and that it is able to overcome most of the language and educational barriers. Understanding the mechanisms of human perception will help you to understand how abstract forms and colors used in data visualization can transmit information more efficient than long paragraphs of text.Top iPad Business Process Diagrams Apps
Review of Business Process Diagram iPad Apps.- Pie Chart Natural Disaster In Mathematics
- Pie Chart For Natural Disasters
- Charts On Disaster Management Pie Chart By Diagram
- Bar Graph Or Pie Chart Of Natural Disaster
- Disaster Management Pie Chart And Bar Graph For Maths
- Pie Chart Or Graph Of Disaster Management
- Flow Chart Of Natural Disasters
- Pie Charts Related To Disaster Management
- Mathematics | Pie Charts | Venn Diagrams | Disaster Management ...
- Drawing For Disaster Management I On Chart
- Chart Which Can Be Prepared On Natural Resource Management
- Disasters Through Bar Graphs
- Ecosystem goods and services - Segmented pyramid diagram | Pie ...
- Classroom Seating Chart Maker | Classroom Layout | Percentage ...
- Charts On Disaster Management
- Schedule pie chart - Daily action plan | Emergency Plan | Process ...
- Chart Drawing In Disaster Management
- Circular Arrows | Circular Arrow | Emergency management exercise ...
- Disaster Management Chart And Diagrams
- Schedule pie chart - Daily action plan | Workflow Diagram Template ...


