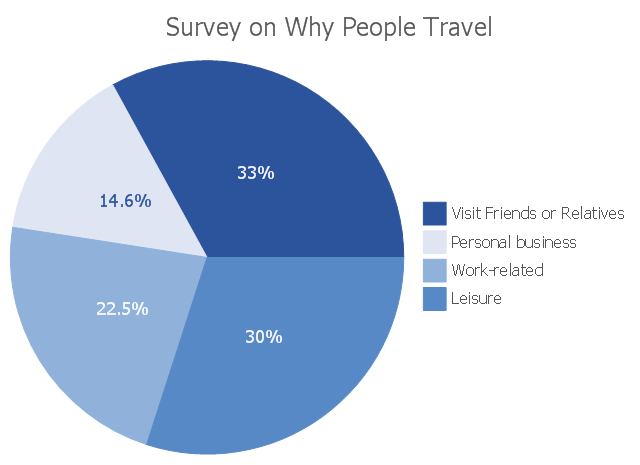
This pie chart sample shows the results of survey on Why People Travel. It was designed on the base of the Wikimedia Commons file: Pie chart.jpeg. [commons.wikimedia.org/ wiki/ File:Pie_ chart.jpeg]
"Travel is the movement of people between relatively distant geographical locations, and can involve travel by foot, bicycle, automobile, train, boat, airplane, or other means, with or without luggage, and can be one way or round trip. Travel can also include relatively short stays between successive movements." [Travel. Wikipedia]
The pie chart example "Survey on Why People Travel" was created using ConceptDraw PRO software extended with the Pie Charts solution from the Statistical Charts and Diagrams area of ConceptDraw Solution Park.
Pie chart
Pie Chart Examples and Templates

This circle pie chart sample was created on the base of the figure illustrating the article "Impacts of Parking Strategies" from the Chicago Metropolitan Agency for Planning website. "Todd Litman's "Cycle of Automobile Dependency" shows how auto-centric land use planning and excessive parking supply have created this situation. Parking management strategies can be used to break this cycle, by changing development patterns and improving travel options (2006)." [cmap.illinois.gov/ about/ 2040/ supporting-materials/ process-archive/ strategy-papers/ parking/ impacts-of-parking-strategies]
The circle pie chart example "Cycle of automobile dependency" was created using the ConceptDraw PRO diagramming and vector drawing software extended with the Target and Circular Diagrams solution from the Marketing area of ConceptDraw Solution Park.
www.conceptdraw.com/ solution-park/ marketing-target-and-circular-diagrams
Circle pie chart

Pie Chart Software

Pie Chart Word Template. Pie Chart Examples

Chart Maker for Presentations

 Customer Journey Mapping
Customer Journey Mapping Solution for ConceptDraw DIAGRAM opens incredibly broad opportunities for marketing and business specialists, product managers, designers, engineers, and other people interested in business development, increasing the product’s audience, its success and users' demand, providing them with capabilities of customer journey mapping. The included diagramming and customer journey mapping tools, predesigned vector customer journey mapping icons and charts, consumer journey mapping connectors, user journey and customer mapping figures, customer experience map icons and touchpoint icons, quick-start templates and samples provide excellent conditions for the customer journey mapping process, for creating Customer Journey Map and Customer Experience Map.
Basic Diagramming


 Directional Maps
Directional Maps solution extends ConceptDraw DIAGRAM software with templates, samples and libraries of vector stencils for drawing the directional, location, site, transit, road and route maps, plans and schemes.
- Survey on Why People Travel
- Business Process Diagrams | Workflow Process Example | How To ...
- Business Process Diagrams | Process Flow Chart For Travel Agency
- How To Create a Workflow Diagram | Travel Agency Bpmn
- SYSML | Pie Chart Examples and Templates | Business Process ...
- Marketing Graph Travel Agency
- Travel Infographics | Risk Diagram (Process Decision Program ...
- Business Process Diagrams | Travel Agency Flowchart
- Travel Agency Organizational Chart Sample
- Draw Travel Map Software