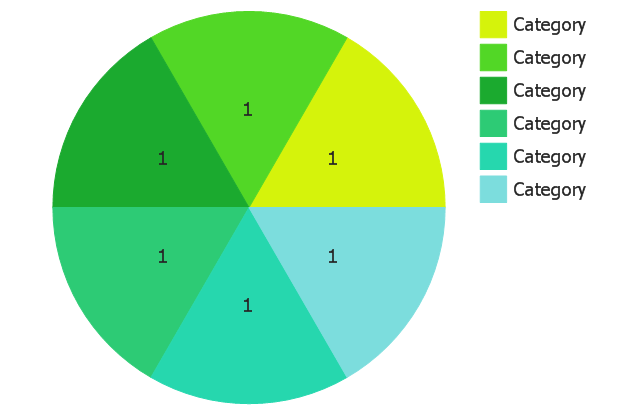
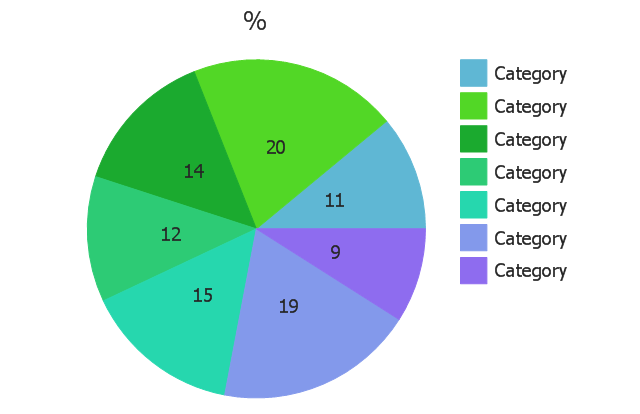
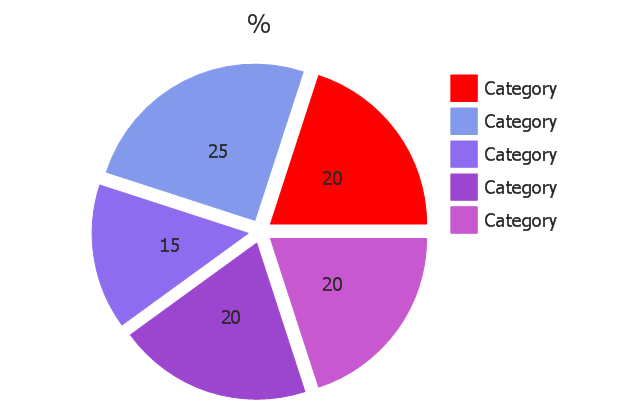
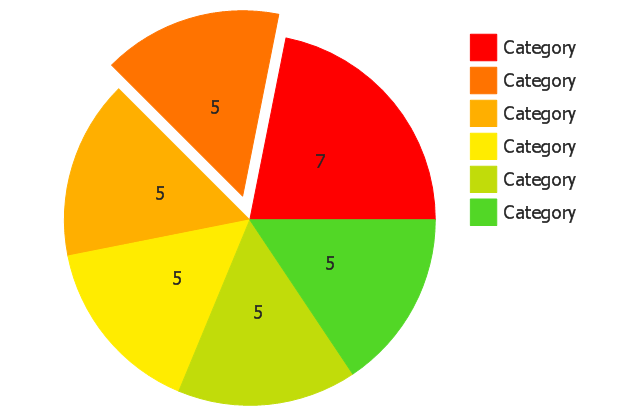
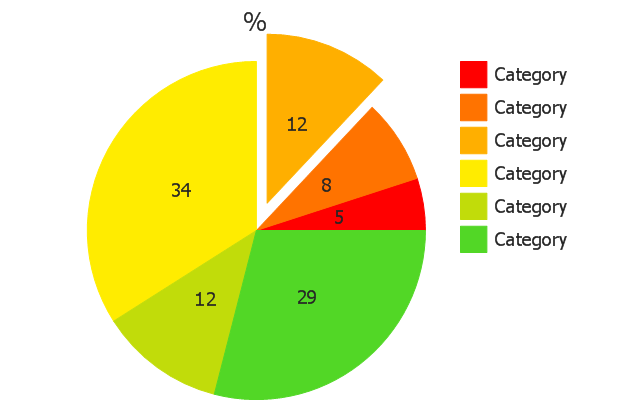
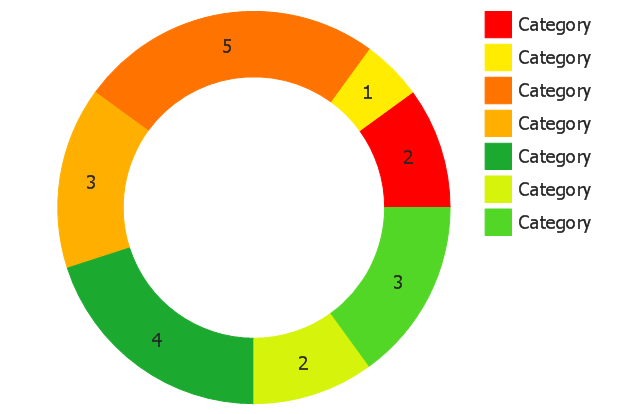
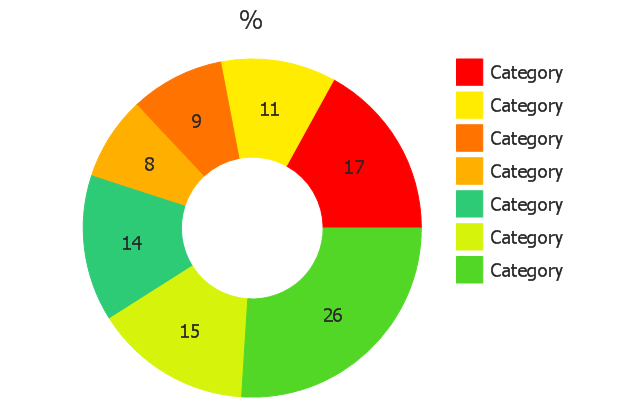
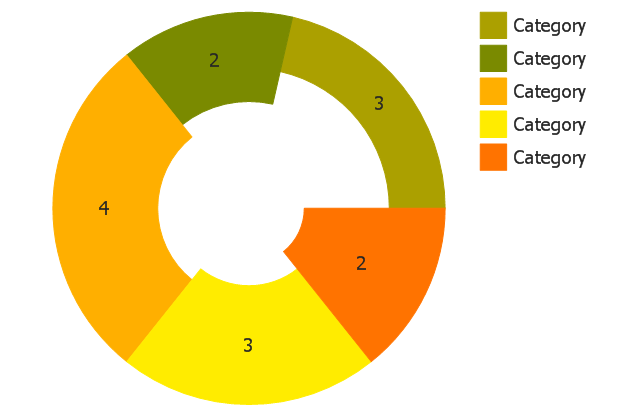
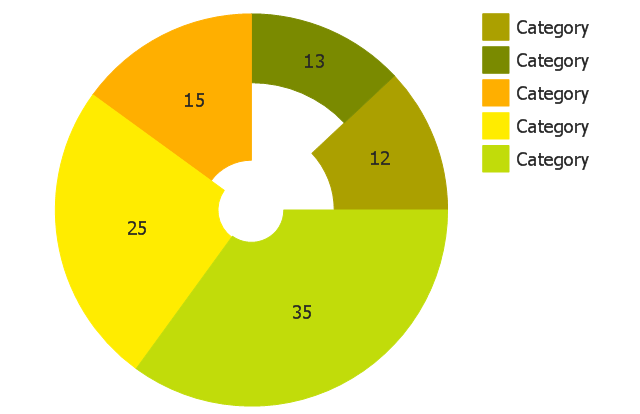
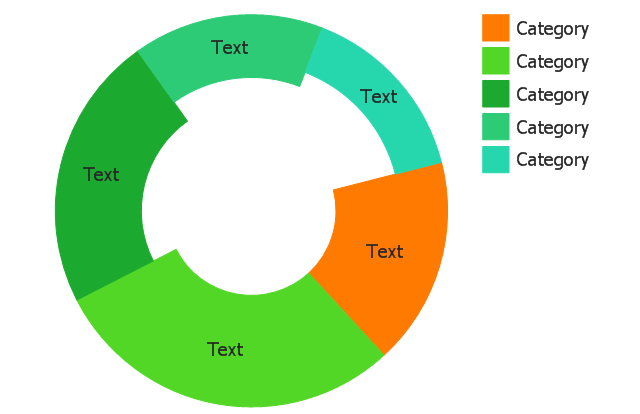
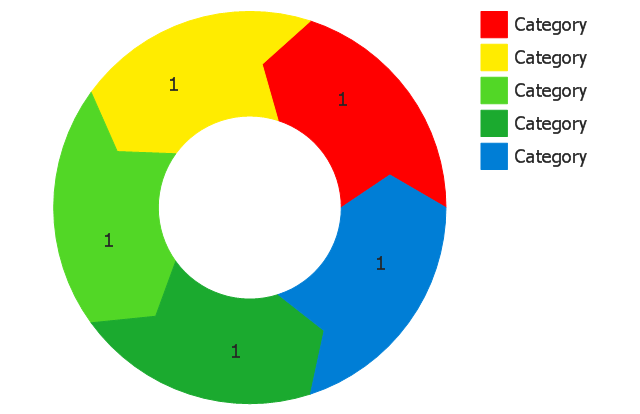
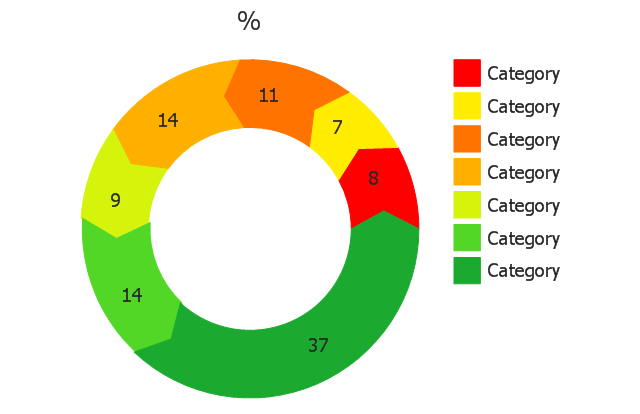
The vector stencils library "Pie charts" contains 30 templates of pie and donut (doughnut, ring) charts for visualizing percentage for parts of one total, or compare parts of few totals.
Drag a template from the library into your document and enter your data.
Use these shapes to draw your pie charts and donut charts in the ConceptDraw PRO diagramming and vector drawing software.
The vector stencils library "Pie charts" is included in the Pie Charts solution of the Graphs and Charts area in ConceptDraw Solution Park.
HelpDesk
How to Draw a Pie Chart Using ConceptDraw PRO
A pie chart represents data, in a clear and easy to read round (pie) form. A circular pie chart is divided into sections (slice). Each "slice" depicts the It reflects the proportion of each component in the whole "pie". This type of chart is most often used for the visualization of statistical data. That is why pie charts are widely used in marketing. As pie charts show proportional proportional parts of a whole, they are good for various visual comparisons. For example, it is difficult to imagine a more intuitive way to show segmentation and market share. ConceptDraw PRO allows you to draw a simple and clear Pie Chart using the Pie Charts solution.The vector stencils library "Pie charts" contains 30 templates of pie and donut (doughnut, ring) charts for visualizing percentage for parts of one total, or compare parts of few totals.
Drag a template from the library into your document and enter your data.
Use these shapes to draw your pie charts and donut charts in the ConceptDraw PRO diagramming and vector drawing software.
The vector stencils library "Pie charts" is included in the Pie Charts solution of the Graphs and Charts area in ConceptDraw Solution Park.
The vector stencils library "Pie charts" contains 30 templates of pie and donut (doughnut, ring) charts for visualizing percentage for parts of one total, or compare parts of few totals.
Drag a template from the library into your document and enter your data.
Use these shapes to draw your pie charts and donut charts in the ConceptDraw PRO diagramming and vector drawing software.
The vector stencils library "Pie charts" is included in the Pie Charts solution of the Graphs and Charts area in ConceptDraw Solution Park.
Drag a template from the library into your document and enter your data.
Use these shapes to draw your pie charts and donut charts in the ConceptDraw PRO diagramming and vector drawing software.
The vector stencils library "Pie charts" is included in the Pie Charts solution of the Graphs and Charts area in ConceptDraw Solution Park.
 Pie Charts
Pie Charts are extensively used in statistics and business for explaining data and work results, in mass media for comparison (i.e. to visualize the percentage for the parts of one total), and in many other fields. The Pie Charts solution for ConceptDraw PRO v10 offers powerful drawing tools, varied templates, samples, and a library of vector stencils for simple construction and design of Pie Charts, Donut Chart, and Pie Graph Worksheets.
Basic Diagramming
Create flowcharts, organizational charts, bar charts, line graphs, and more with ConceptDraw PRO.
Social Media Flowchart Symbols
Social media is a popular view of mass communication which allows people, companies and organizations create, share, discover, modify, access, comment, discuss and exchange information through the Internet. Social Media Response solution for ConceptDraw PRO provides collection of 10 libraries with diversity of predesigned vector social media flowchart symbols for fast and easy creating interactive Social Media Flowcharts, Response Charts and Action Mind Maps."Time management is the .. process of planning and exercising conscious control over the amount of time spent on specific activities, especially to increase effectiveness, efficiency or productivity. Time management may be aided by a range of skills, tools, and techniques used to manage time when accomplishing specific tasks, projects, and goals complying with a due date. Initially, time management referred to just business or work activities, but eventually the term broadened to include personal activities as well. A time management system is a designed combination of processes, tools, techniques, and methods. Time management is usually a necessity in any project development as it determines the project completion time and scope." [Time management. Wikipedia]
This timetable pie chart shows the plan of daily actions and its durations in minutes.
It is useful visual tool of personal time management.
This schedule pie chart example was created using the ConceptDraw PRO diagramming and vector drawing software extended with the Target and Circular Diagrams solution from the Marketing area of ConceptDraw Solution Park.
www.conceptdraw.com/ solution-park/ marketing-target-and-circular-diagrams
This pie chart sample shows the make up of the top one percent of United States wage earners, grouped by occupation. Data for this graph is sourced from the November 2010 report written by Jon Bakija, Adam Cole, and Bradley T. Heim titled "Jobs and Income Growth of Top Earners and the Causes of Changing Income Inequality: Evidence from U.S. Tax Return Data", column "2005" in table 2, titled "Percentage of primary taxpayers in top one percent of the distribution of income (excluding capital gains) that are in each occupation", on page 50.
This pie chart sample was redesigned from the Wikimedia Commons file: Percentage of the top 1% wage earners in the United States by occupation (pie chart).svg.
[commons.wikimedia.org/ wiki/ File:Percentage_ of_ the_ top_ 1%25_ wage_ earners_ in_ the_ United_ States_ by_ occupation_ (pie_ chart).svg]
This file is licensed under the Creative Commons Attribution-Share Alike 3.0 Unported license. [creativecommons.org/ licenses/ by-sa/ 3.0/ deed.en]
"The distribution of wealth is a comparison of the wealth of various members or groups in a society. It differs from the distribution of income in that it looks at the distribution of ownership of the assets in a society, rather than the current income of members of that society." [Distribution of wealth. Wikipedia]
The pie chart example "Percentage of the top 1% wage earners in the US by occupation" was created using the ConceptDraw PRO diagramming and vector drawing software extended with the Pie Charts solutiton of the Graphs and Charts area in ConceptDraw Solution Park.
Chore charts with ConceptDraw PRO
Chore chart. Draw perfect-looking chore chart. Free chore chart samples. All about chore charts.- Time Management Tables And Pie Charts
- Schedule pie chart - Daily action plan | Basic Diagramming | Pie ...
- Schedule pie chart - Daily action plan | Pie Table Timetable
- Composition Conversion Of Graphics Pie Chart Bar Chart Table
- Hw To Draw Pie Chart To Time Table
- Pie Chart Examples and Templates | Examples of Flowcharts, Org ...
- Conversation Of Graphic Pie_chart Bar_chart Table Flow Charts
- How to Draw a Pie Chart Using ConceptDraw PRO | Schedule pie ...
- Percentage Pie Chart . Pie Chart Examples | Business Report Pie ...
- Pie charts - Vector stencils library
- Pie charts - Vector stencils library
- Defination Of Graphics Pie Chart Bar Chart Table Flow Chart
- Composition Conversion Of Graphics Pie Chart Bar Chart Table
- Pie Chart Vs Table
- Conversion Of Graphics And Pie Chart Table And Flow Bar Chart
- Pie Chart Classroom Parts With Table Chaire
- How to Draw a Pie Chart Using ConceptDraw PRO | Pie Chart ...
- Images Of Bar Graph Pie Chart Table Graph And Diagram On One
- Conversion Of Graphics Pie Chart Table Flow Chart
- How to Draw a Pie Chart Using ConceptDraw PRO | Banquet Hall ...
-pie-charts---vector-stencils-library.png--diagram-flowchart-example.png)
-pie-charts---vector-stencils-library.png--diagram-flowchart-example.png)
-pie-charts---vector-stencils-library.png--diagram-flowchart-example.png)
-pie-charts---vector-stencils-library.png--diagram-flowchart-example.png)
,-control-dots-pie-charts---vector-stencils-library.png--diagram-flowchart-example.png)
-pie-charts---vector-stencils-library.png--diagram-flowchart-example.png)
-pie-charts---vector-stencils-library.png--diagram-flowchart-example.png)
-pie-charts---vector-stencils-library.png--diagram-flowchart-example.png)
-pie-charts---vector-stencils-library.png--diagram-flowchart-example.png)
-pie-charts---vector-stencils-library.png--diagram-flowchart-example.png)
-pie-charts---vector-stencils-library.png--diagram-flowchart-example.png)
-2-pie-charts---vector-stencils-library.png--diagram-flowchart-example.png)
-2-pie-charts---vector-stencils-library.png--diagram-flowchart-example.png)
,-control-dots-pie-charts---vector-stencils-library.png--diagram-flowchart-example.png)
-pie-charts---vector-stencils-library.png--diagram-flowchart-example.png)
-pie-charts---vector-stencils-library.png--diagram-flowchart-example.png)


